The Audio Waveform Generator lets you verify a freshly generated waveform three ways: by reading the reported peak-column count (the smaller of the requested width, 1,000, and the decoded frame count), by opening the on-page SVG text inspector, and by downloading the SVG file to confirm its width, height, background, and waveform colors match what you set. All three checks run locally in the same browser tab where the image was generated, so the result you inspect is the exact string that the download button saves. The preview, the inspector, and the download are intentionally identical so that what you see is what you keep.
That separation matters because a waveform picture is only useful when you can trust it. A silent clip should look flat. A drum hit should produce a tall vertical line. A clipped recording should show peaks reaching toward the top and bottom of the picture rather than sitting politely in the middle. None of those checks are automatic; you confirm them by inspecting the numbers, the lines, and the file that comes out the other end.
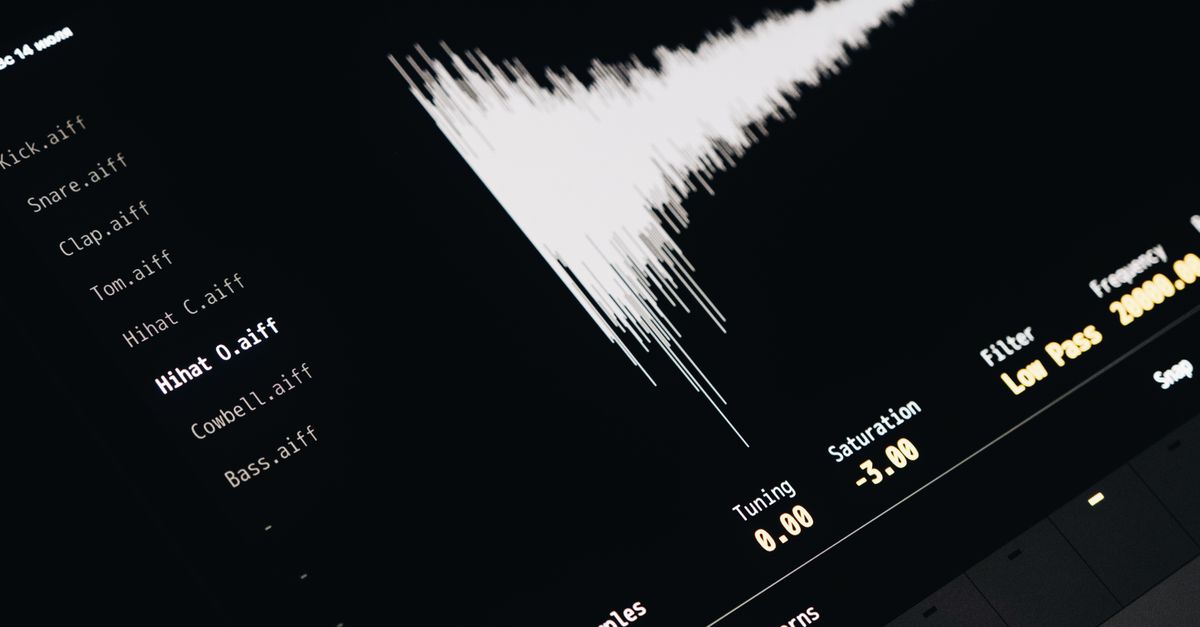
What the Audio Waveform Generator Actually Produces
The generator takes the audio file you select, decodes it in the browser through the Web Audio API's AudioBuffer, and produces one static SVG overview rather than a PNG, JPEG, video, or rewritten audio file. The decoded sample frames are split into equal index ranges, and for each range the tool finds the minimum and maximum finite sample across every decoded channel. Defensive out-of-range values are clamped to -1 through 1, and one vertical SVG line is drawn from the bucket maximum down to its minimum. That keeps short positive and negative peaks honest instead of grabbing one arbitrary sample per bucket.
Because the output is text-based SVG, every coordinate, dimension, and color is a literal character in the file. The page exposes that string in an expandable inspector, and the download uses the same exact string. There is no hidden preprocessing step or server-side rendering that could drift between what you preview and what you save.
The Three Ways to Check Your Result
You do not have to pick one verification path; the tool gives you three and expects you to use them together.
- Numeric readout. After you generate, the page reports the decoded frame count and the peak-column count actually drawn. Comparing those two numbers tells you whether your clip ran out of audio before it ran out of columns, or whether the 1,000-column ceiling kicked in for a long file.
- Visual preview. The preview pane shows the SVG rendered at the size you set. The vertical center sits at half the requested height, and full-scale positive or negative samples extend to 45 percent of the height above or below that center, leaving a five-percent margin at the top and bottom.
- Downloaded file. The download is plain SVG with a matching viewBox, so the same image stays sharp when placed at another display size. Opening it in a text editor or SVG-aware tool lets you read every line element directly.
Check the Result Step by Step
- Open the Audio Waveform Generator and choose one browser-decodable audio file. Stick to formats your current browser and operating system can actually decode — MP3, WAV, M4A, AAC, Ogg, WebM, or FLAC — and stay inside the published limits: a 50 MiB compressed ceiling, five-minute maximum duration, 1–8 channels, 8,000–192,000 Hz sample rate, and 30 million total channel samples. Unsupported, corrupt, empty, or mislabeled files return an error rather than producing a misleading image.
- Set the SVG width between 320 and 1,600 pixels and the height between 120 and 600 pixels. Pick a background color and a waveform color from the browser's six-digit hexadecimal color controls. The width you request sets the upper bound on horizontal resolution; the actual column count is the smaller of that width, 1,000, and the decoded frame count.
- Generate the local peak envelope. Decoding, bucketing, color validation, and SVG assembly all happen in your current tab. Nothing is uploaded.
- Read the reported frames and peak-column count. If the column count equals the frame count, your clip is short enough that one frame maps to one column. If the column count equals 1,000, your clip was long enough to fill the SVG horizontally and additional audio frames were combined into the same bucket as its clamped minimum and maximum.
- Inspect the preview for shape sanity. Loud sections should reach toward the top and bottom edges; silent sections should hug the centerline. Tall spikes correspond to short positive or negative peaks inside their bucket.
- Open the SVG text inspector and skim the markup. You should see one background rectangle and a group of vertical peak lines. Each line's y-coordinates should be deterministic given the bucket's clamped minimum and maximum.
- Download the SVG and confirm it matches the preview. The downloaded file uses the exact same string as the inspector, so opening it in any SVG-aware editor reproduces the identical picture.
- Regenerate whenever an input changes. Selecting a new file, changing an option, or generating again revokes the previous object URL so an older image cannot appear to represent newer inputs.
Reading the Reported Numbers and SVG Inspector
The two numbers the page surfaces after a generation are the decoded frame count and the peak-column count. Their relationship is the most informative thing the readout tells you, and it follows a single rule: columns = min(width, 1,000, frames). A 12-second 44.1 kHz mono clip decodes to roughly 529,200 frames, so columns cap at 1,000 and roughly 529 frames feed each column. A 2-second mono clip at the same rate decodes to about 88,200 frames, so with a width of 1,600 the column count lands at 1,000 (the smaller of 1,600, 1,000, and 88,200) — not the full 1,600 you requested.
The SVG inspector turns those numbers into geometry. With a requested height of 400, the vertical center sits at y=200. A full-scale positive sample lands at y=200 − 0.45 × 400 = 20 (the 5% top margin), and a full-scale negative sample lands at y=200 + 0.45 × 400 = 380 (the 5% bottom margin). Any line whose y-coordinates stay close to 200 across many columns marks a quiet passage; lines that reach toward 20 or 380 mark the loudest moments in the file.
| What you see | What it usually means |
|---|---|
| Column count equals frame count | Short clip; one frame per column, no averaging |
| Column count equals 1,000 | Long enough to fill the SVG; multiple frames collapsed per column |
| Column count equals requested width | Requested width was smaller than 1,000 and smaller than the frame count |
| All lines hug the centerline | Near-silent source or near-DC content |
| Lines touch top and bottom margins | Full-scale or clipped peaks in the source |
| No visible left and right lanes | Combined multichannel peak overview, not separate channels |
Limits That Change What a "Correct" Result Looks Like
A correct result is one that honestly represents the audio you selected, not one that looks visually pleasing. A few limits matter enough to check before you trust the picture:
- Decoded frame budget. The 30 million channel-sample budget and the five-minute duration cap exist because a small compressed file can expand into large floating-point arrays. Over-limit audio is rejected as a whole; the waveform is not silently made from only the beginning of the file.
- Channel identity. For stereo or multichannel files the image is a combined peak overview. A single bucket can take its minimum from one channel and its maximum from another. The picture does not display separate left and right lanes, preserve channel identity visually, or average channels into a new audio signal.
- Codec reality. Web Audio reads an MP3, WAV, M4A, AAC, Ogg, WebM, or FLAC file only when the current browser and operating system actually support its real codec. An extension or MIME label is not enough; a file that fails to decode returns an error instead of a false waveform.
- Color controls. Background and waveform colors must come from the browser's six-digit hexadecimal controls. SVG markup is generated from validated numbers and those colors rather than copied from filenames or embedded source metadata.
When the Picture Looks Right but Isn't Honest
A peak envelope is not a calibrated loudness meter, a spectrogram, or a clipping detector in the audio-engineering sense. Two recordings can show nearly identical peak heights while sounding very different, because perceived loudness depends on duration, frequency balance, dynamics, and playback conditions. Time still runs left to right, but the vertical line represents the amplitude range inside one bucket — not frequency, not beats, not notes. If a result looks "too neat," that is the bucket method doing its job, not the audio being uniform.
Use the picture for visual placement, presentation, and quick sanity checks. Do not use it to diagnose hearing, equipment, clipping history, phase, or mastering compliance. For any of those tasks, return to a tool that exposes the underlying samples per channel rather than the combined envelope. If the picture shows peaks where you expected silence, or silence where you expected peaks, regenerate after re-checking the file you actually selected; older object URLs are revoked on every change, so a stale image cannot be mistaken for a current one.
Common reasons a result looks wrong usually trace back to inputs, not the generator itself. Walking through a focused guide on avoiding mistakes when generating an audio waveform is a useful next step whenever the picture does not match your expectation, because the same column-count rule, color validation, and revocation behavior apply across every run.