A CMYK to RGB chart is a lookup table — or interactive tool — that maps four print-ink percentages (cyan, magenta, yellow, and black, each from 0 to 100) into an approximate 8-bit screen color expressed as red, green, and blue channels plus a six-digit hexadecimal value. The conversion uses the W3C naive device-CMYK fallback, which combines each color ink with black, inverts the result, and scales it to the 0 to 255 display range. That means CMYK (0, 100, 100, 0) always produces rgb(255, 0, 0), the same pure red on screen regardless of which browser or printer profile you use. A chart is most useful when you need a quick visual reference for how an uncalibrated CMYK recipe might look on an sRGB-style display, such as while mocking up a screen layout from a printer's swatch book or comparing rough palettes across formats. The values are deliberately approximations; real print output depends on the press, ink set, paper, dot gain, rendering intent, and embedded ICC profile, which a chart cannot reproduce. For an interactive chart that updates as you move the sliders, the CMYK To RGB tool reads the four percentages and shows the resulting RGB channels, hex value, and swatch immediately.
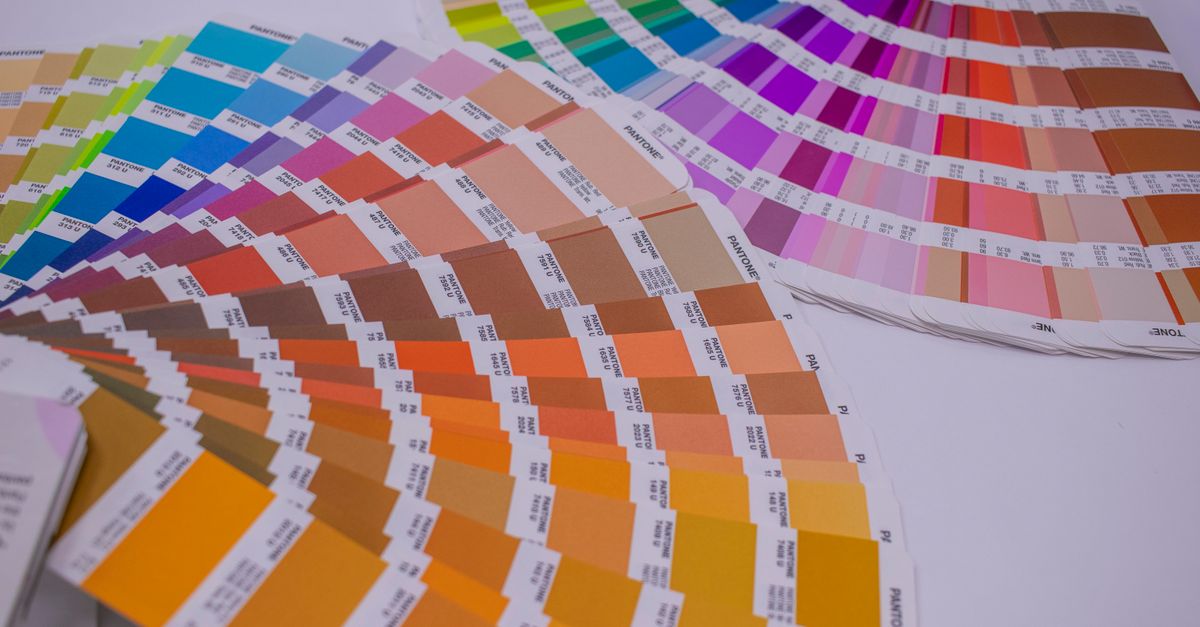
What a CMYK to RGB Chart Shows
A traditional CMYK to RGB chart is laid out as a grid of ink percentages on one axis and the resulting screen color on the other, often with each cell showing a colored swatch, the RGB triplet, and the hex code. A browser-based chart functions the same way but dynamically: instead of looking up a fixed value in a printed table, you adjust four sliders and read the result. The four inputs are always cyan (C), magenta (M), yellow (Y), and key or black (K), each expressed as a percentage from 0 to 100. The outputs are three 8-bit channels (red, green, blue) and a six-digit hexadecimal value formatted as #RRGGBB. A visual swatch is included so you can see the color without plugging numbers into another program.
The reason a chart exists at all is that CMYK and RGB describe different color worlds. CMYK is subtractive ink on paper: each ink absorbs part of the reflected light. RGB is additive light on a screen: each channel emits a portion of the visible spectrum. A chart is a translation layer between the two, useful whenever someone hands you CMYK percentages — from a print spec, a Pantone conversion, a designer, or a printer — and you need to drop an approximate color into a digital layout. The chart does not replace color management; it complements it by giving you a fast screen-side reading of any four-ink recipe you already have.
How the W3C Naive Conversion Math Works
The W3C CSS Color specification publishes a naive device-CMYK to sRGB formula as a fallback when no ICC profile is available, and the browser chart described here follows that same recipe. For each display channel you start with the fraction of the opposite color ink (cyan for red, magenta for green, yellow for blue), multiply that by one minus the black percentage, then add the black percentage itself, clamp the intermediate value to the range 0 to 1, invert it, and scale to the 0 to 255 range.
Written as one expression, the red channel is:
R = 255 × (1 − min(1, C × (1 − K) + K))
Green and blue use the same formula with M and Y swapped in for the colorInk term. Each channel is then serialized as an integer between 0 and 255, and the three integers combine into a hex value by converting each to two hexadecimal digits.
Worked example. Take the CMYK recipe C = 0%, M = 50%, Y = 50%, K = 25%. Normalize the percentages to fractions: C = 0, M = 0.5, Y = 0.5, K = 0.25.
For the red channel, substitute into the formula: R = 255 × (1 − min(1, 0 × (1 − 0.25) + 0.25)) R = 255 × (1 − min(1, 0 + 0.25)) R = 255 × (1 − 0.25) R = 255 × 0.75 R = 191.25 → 191
For green and blue, the same recipe with M and Y: G = 255 × (1 − min(1, 0.5 × 0.75 + 0.25)) G = 255 × (1 − min(1, 0.375 + 0.25)) G = 255 × (1 − 0.625) G = 255 × 0.375 G = 95.625 → 96
The blue channel is identical to green because Y equals M in this recipe: B = 96
Final result: rgb(191, 96, 96), which serializes to the hex value #BF6060. The chart would render this as a soft brick red swatch. Notice how a modest 25 percent black (K) pull significantly darkens what would otherwise be a brighter pink — that is the role black plays in CMYK, and the reason it must be converted correctly when you read a chart. Plug the same four percentages into any device and the naive formula returns the same answer, which is what makes the chart reproducible.
How to Read a CMYK to RGB Chart in Your Browser
For an interactive CMYK to RGB chart that updates as you change the ink percentages, the simplest workflow runs entirely in your browser:
- Open the CMYK To RGB tool and locate the four sliders or input fields labeled cyan, magenta, yellow, and black.
- Enter each value as a percentage from 0 through 100. Use whole numbers for quick work, or finer decimals if your recipe calls for them.
- Read the three display channels (R, G, B) shown beside the swatch; the hex value updates at the same time.
- Copy the hex value or the RGB triplet into your design tool, mockup, or stylesheet as the approximate screen color.
- Treat the result as a preview only — keep your original CMYK numbers for the printer and confirm the final color against a physical proof or ICC-based workflow.
Because the math runs locally, you can experiment freely without uploading a swatch list, color book, or recipe file to any server. That makes the chart convenient for spot-checking individual recipes before committing them to a layout, and for comparing several variants side by side without re-exporting from your design application.
When a Chart Is Enough and When You Need ICC Profiles
A chart is a starting point, not a contract. Real CMYK is device-dependent: the press model, the ink set, the paper stock, the dot gain, the rendering intent, and the embedded ICC profile can all change what the printed sheet looks like. The W3C naive formula used by a browser chart is, by design, an unprofiled approximation. It ignores all of those variables and produces a single screen value for a single CMYK recipe.
You can rely on a chart when the color only needs to be approximate: wireframes and screen mockups drawn from a Pantone book, rough palette comparisons across media, blog illustrations referencing a brand's printed swatch, or quick "will this even be visible?" checks. You cannot rely on a chart when the color has to match on press — packaging, contractual proofs, brand-critical collateral, color-managed photography, or any workflow where a print buyer or QA step measures the output against a target.
For print-accurate conversion, use a profile-aware application such as Photoshop, Illustrator, Acrobat, or a dedicated color-managed workflow. Load the correct source CMYK profile (usually supplied by your printer) and the correct destination RGB profile (typically sRGB or a calibrated display profile), choose the appropriate rendering intent, and re-render through the engine. The chart's output will often differ from this result, sometimes by several perceptible steps, which is exactly the trade-off the W3C specification acknowledges in describing the naive path as a fallback.
Browser Chart vs Profile-Aware Software
The two approaches are not competing tools — they solve different problems. A chart gives you a fast, transparent preview using a published formula; a profile-aware application gives you a press-faithful conversion using calibrated color science. The first informs your decisions during design; the second protects them at the press.
| Need | Browser CMYK to RGB chart | Profile-aware application |
|---|---|---|
| Quick screen preview of a CMYK recipe | Ideal use case | Overkill |
| Mockup or wireframe from a swatch book | Good fit | Unnecessary |
| Press proof or contractual color target | Not suitable | Required |
| Matching the output of a specific printer or paper | Approximation only | Required with ICC profiles |
| Sharing approximate colors with a collaborator | Convenient hex value | May add complexity |
| Privacy and no-upload requirement | All math runs locally | Depends on tool |
For designers who already work in CMYK but need screen previews without re-exporting every swatch, an interactive chart sits naturally between the print and screen worlds. For a one-shot conversion back from screen to print values, the RGB to CMYK conversion guide walks through the reverse workflow. Whenever you need a quick check of how a recipe will read on screen, the chart returns an immediate answer; whenever a customer or printer measures the final sheet, the ICC profile takes over.
The conversion math itself is defined in the W3C CSS Color 4 specification under the device-CMYK section, which describes the naive formula this chart implements as the documented fallback when no profile is available.
For a deeper look, see CMYK to RGB CSS Code: Convert Print Inks to Hex.