A free audio waveform generator turns a decoded audio file into a static, scalable picture that shows the loudest and quietest sample in each slice of time. The picture is drawn from real audio data — minimum and maximum sample values across every decoded channel inside fixed, evenly sized frame ranges — and saved as a vector graphic you can place on a webpage, in a slide deck, or in a video timeline. Because the SVG is generated from validated numbers and chosen colors rather than from filenames or embedded source metadata, the output is reproducible: the same file, width, height, and color pair always produce the same SVG markup. The decoding, peak extraction, SVG writing, preview, and download all happen inside your current tab, so the original audio and the resulting graphic never leave the browser, and the same file returns the same picture every time you generate it. No server round-trip, no account, no file extension trickery — the picture is just the math of your decoded audio plus the SVG markup.
The Audio Waveform Generator handles that whole workflow inside your current tab. You pick a file your browser can actually decode, choose a width between 320 and 1,600 pixels and a height between 120 and 600 pixels, set a background and a waveform color from standard six-digit hexadecimal controls, and the tool writes a single SVG with one background rectangle and a group of vertical peak lines. The original audio is never rewritten, the file is never uploaded, and the graphic is never sent anywhere — peak extraction, SVG generation, preview rendering, and the download all stay local to the tab that produced them.
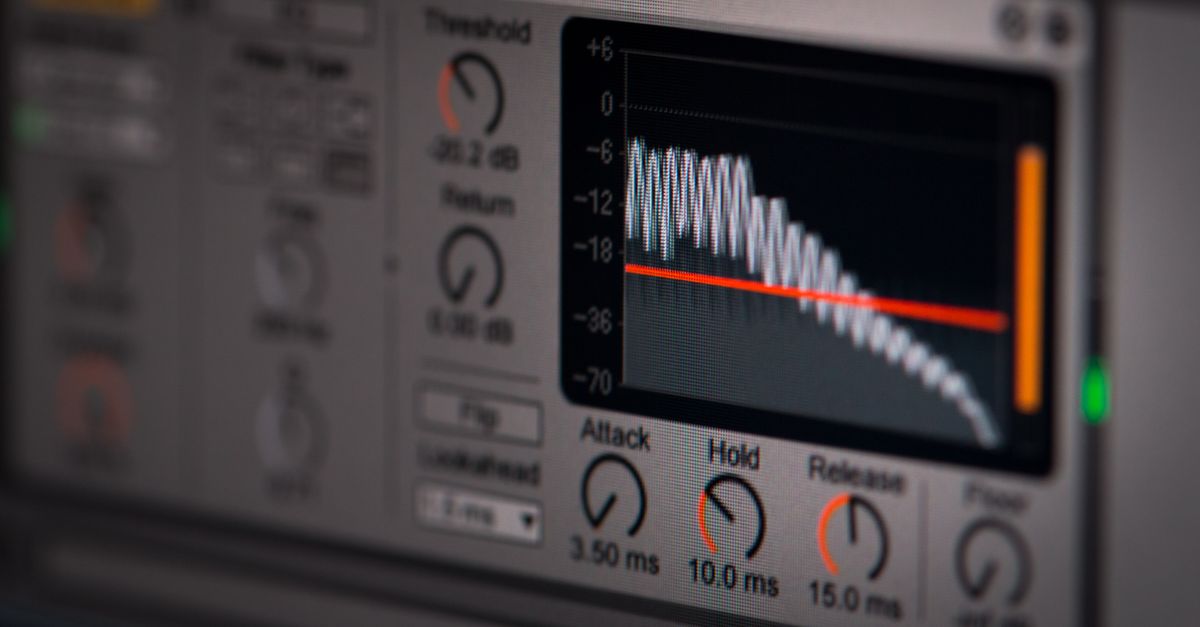
What a free browser-based audio waveform generator actually does
Audio waveforms in this category are time-domain pictures, not frequency pictures. The horizontal axis is time moving from the first decoded frame to the last, and the vertical axis is sample amplitude. A vertical line at each horizontal position shows the difference between the loudest positive sample and the quietest sample found in that bucket across every channel. Tall lines mean a moment in the file where the signal reached close to full scale in both directions; short lines mean the audio was quiet or nearly silent.
The tool follows a deliberately simple peak-envelope method. Every decoded sample frame is placed into one of N contiguous buckets, where N is the smaller of your requested image width, 1,000, and the total number of decoded frames. For each bucket the tool scans the included frames, takes the minimum and maximum finite sample across every decoded channel, clamps defensive out-of-range values to the −1 to 1 range, and draws one vertical SVG line from that bucket's maximum to its minimum. The first bucket starts at frame zero and the last bucket ends at the final decoded frame, so no frames are skipped between adjacent ranges.
Two practical consequences fall out of that design. First, short clips do not get more independent measurements than the file actually contains — the bucket count is capped by the decoded frame count, so a clip with fewer frames than the requested width and the 1,000-column cap is held to its own frame count, while a longer clip with far more frames is held to the 1,000-column cap so the SVG output and the processing stay bounded. Second, the picture is a combined peak overview rather than separate left-and-right lanes, so a bucket's minimum can come from one channel and its maximum from another.
How peak-envelope sampling shapes the output
The choice to take the minimum and maximum per bucket instead of a single arbitrary sample per bucket is what makes short transients visible. A snare hit, a hand clap, or a single drum transient lasts only a handful of samples, and a single-sample method often picks a quieter moment inside the bucket and hides the spike. The minimum-and-maximum method finds both the loudest positive spike and the loudest negative spike, so brief moments of full-scale audio still register as full-height lines rather than blending into the surrounding silence.
Vertical coordinates in the output are deterministic. The vertical center sits at exactly half the requested height, and a sample at +1 or −1 extends to 45 percent of the height above or below that center. That leaves a five-percent margin at the top and bottom so the picture never touches the edges. Columns are evenly centered across the requested width, which means you can place the SVG in any layout without manually nudging margins or compensating for uneven column spacing.
For stereo or multichannel files the picture is intentionally a combined overview. A bucket's minimum can come from the left channel while its maximum comes from the right, and the tool never averages channels into a new signal. If you need separate left and right lanes, render each channel through an audio editor that exposes them as individual tracks rather than expecting the waveform picture to do it for you.
Generate an audio waveform in three steps
- Choose one browser-decodable audio file within the stated compressed and decoded limits. The tool accepts MP3, WAV, M4A, AAC, Ogg, WebM, or FLAC, but only when the current browser and operating system can actually decode the real codec — an extension or MIME label cannot guarantee that. Unsupported, corrupt, empty, or disguised files return an error instead of a partial picture.
- Set the SVG width, height, background color, and waveform color, then generate the local peak envelope. Width can be 320–1,600 pixels and height 120–600 pixels. Colors come from the browser's six-digit hexadecimal color controls, and the SVG is generated from validated numbers and those colors rather than copied from filenames or embedded source metadata.
- Check the reported frames and peak-column count, inspect the preview or SVG text, and download the exact scalable SVG. The page shows the exact generated SVG markup in an expandable inspector, and the download uses that identical string. Selecting a replacement file, changing an option, generating again, or leaving the page revokes the obsolete object URL so an older image cannot appear to represent new inputs.
After the download, the file is a text-based SVG that contains one background rectangle, a group of peak lines with fixed pixel dimensions, and a matching viewBox. The SVG stays sharp when placed at another display size, but extremely large print or editing workflows may still require different stroke widths or more detailed source data — open the file in an SVG-aware editor if you need to tweak stroke width, swap colors, or add labels.
Limits the tool checks before processing your file
The browser-side audio tools share a common set of decoded-data budgets, and the waveform tool applies every one of them. The compressed file must be at most 50 MiB. The decoded audio must last no more than five minutes, contain one through eight channels, use a rate from 8,000 through 192,000 Hz, and remain within 30 million channel samples. These checks matter because a small compressed file can expand into much larger floating-point channel arrays, and over-limit audio is rejected as a whole rather than silently truncated to the beginning.
| Limit | Allowed range |
|---|---|
| Compressed file size | Up to 50 MiB |
| Decoded duration | Up to 5 minutes |
| Channels | 1 to 8 |
| Sample rate | 8,000 to 192,000 Hz |
| Total channel samples | Up to 30,000,000 |
| Image width | 320 to 1,600 pixels |
| Image height | 120 to 600 pixels |
| Peak columns | min(width, 1,000, decoded frames) |
If any one of those numbers falls outside the allowed range, the tool rejects the file as a whole rather than producing a partial picture. The bucket count caps matter independently: a long clip with millions of frames still produces at most 1,000 columns, which keeps the SVG output size and the processing time bounded regardless of how long the original audio actually is.
Comparing SVG with other waveform image formats
| Format | Stays sharp when scaled | Editable as plain text | Exported by this tool |
|---|---|---|---|
| SVG (this tool's output) | Yes | Yes | Yes |
| PNG | No — fixed raster | No | No |
| JPEG | No — fixed raster, lossy | No | No |
| GIF | No — fixed raster, palette | No | No |
The decisive difference is that SVG is a vector format, so it describes each peak line with a coordinate and a color rather than with a grid of pixels. Place the same SVG inside a 300-pixel card or a 1,500-pixel hero banner and the lines stay one pixel wide and sharp, while a PNG generated for the smaller size turns fuzzy the moment it scales up. SVG is also plain text, so the inspector on the page and any text editor can read or modify it; the other formats are not human-readable and lose fidelity the moment you re-export them.
Picking dimensions, colors, and a placement for the SVG
Width and height determine the picture's aspect ratio more than anything else. A 1,200-by-200 image gives you a long, thin strip that is a natural fit for blog headers, podcast episode pages, and audio player skins. A 600-by-600 image gives you a square block that suits social media cards and inline illustrations. Anything taller than roughly 1:3 starts to waste vertical space because most audio sits below full scale and rarely fills the available height.
Background and waveform colors come from standard six-digit hexadecimal values, and the contrast between them is what makes the peaks visible. A near-white waveform on a near-black background is the easiest to read on most web pages; a dark waveform on a light card works on paper and on slide decks. Whatever you pick, the tool writes the colors into the SVG directly, so any theme or branding change downstream is a matter of opening the file in an SVG editor and replacing two strings.
The output is also deterministic, which matters when you place the same waveform on several pages or screens. The same source audio, width, height, and color pair always produce the same SVG markup, with the same column positions and the same line coordinates, so two episodes of a podcast can share a visual style without manual alignment. Because the picture is regenerated from the same numbers rather than re-encoded, swapping the color of one element does not shift the column positions of any other element.
When a peak waveform is the right picture — and when it isn't
A peak waveform is a faithful picture of how loud each moment of the audio got. It is not a calibrated loudness meter, and two recordings can show very similar peaks while sounding different because perceived loudness depends on duration, frequency balance, dynamics, and playback conditions. It is also not a spectrogram: time still runs left to right, but the vertical line in this picture represents sample amplitude range, not frequency. Do not use the output to diagnose hearing, equipment, clipping history, phase, or mastering compliance.
The picture is the right choice when the goal is to give a viewer an immediate visual cue about how loud or busy a recording is. It is the wrong choice when you need frequency content (use a spectrogram for that), a calibrated loudness reading (use a LUFS meter), or separate left and right channels (render each channel individually through an audio editor). The Web Audio API exposes the decoded frames that feed this tool as a structured AudioBuffer, and the peak-envelope method described here sits on top of that buffer without modifying it.
For a deeper look, see Generate Audio Waveform Not Working: A Browser Fix.
For a deeper look, see How to Convert Audio to Waveform: A Local SVG Method.