Pie Chart Maker on Mac turns “Label, Value” rows into a color-coded pie chart with a legend and percentages, then saves the finished chart as a PNG in your browser—without installing software or uploading data.
For a meeting slide, report figure, message attachment, or quick check of how a total divides, open the Pie Chart Maker in the browser on your Mac. There is no sign-up, no macOS installation, and no waiting for a server to process the chart.
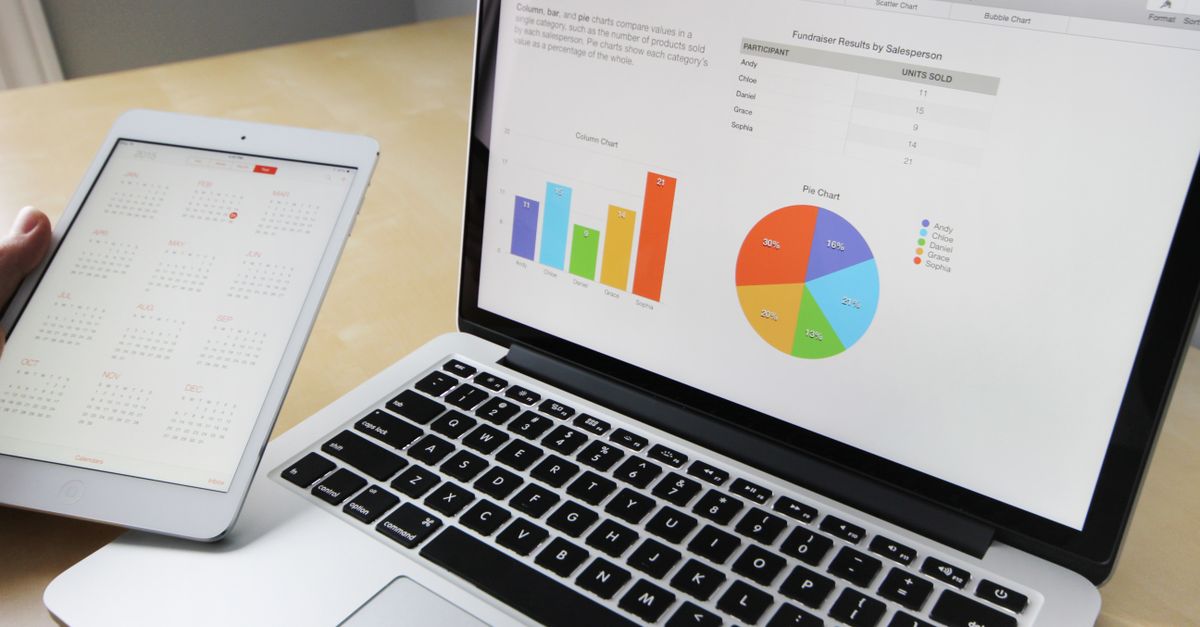
Make a pie chart on your Mac
The complete Mac workflow takes place in one browser tab:
- Open the Pie Chart Maker. Load the tool in the browser on your Mac and locate the data box. No separate desktop application, account, or installation is required.
- Enter or paste your labels and values. Put one item on each line in the format “Label, Value.” For example:
- Chrome, 63
- Safari, 20
- Review the live chart. As you type valid data, the pie chart redraws immediately. Each slice receives a distinct built-in color, while the legend shows the label, raw value, and calculated percentage.
- Add a title if needed. Enter an optional chart title, which appears above the pie. A clear title helps explain what the complete circle represents.
- Download the PNG. When the chart looks right, click Download. The browser-generated image has a white background and crisp edges, making it ready for a document, presentation, or message.
This method produces a finished image rather than an editable chart object. If you need to change the data later, return to the input box and edit the relevant row; the preview redraws from the updated values.
Set up the input correctly
The input format is deliberately simple, but the value after the final comma must be a valid non-negative number. The maker skips malformed lines instead of stopping the entire chart, so review the legend after pasting to confirm that every intended category appears.
| Input detail | What the maker does | What to do |
|---|---|---|
| One item per line | Reads each label and value as a separate category. | Keep every “Label, Value” pair on its own line. |
| Blank lines | Ignores them. | Extra blank lines are harmless. |
| Spaces around a label or number | Trims them during input processing. | You do not need to remove ordinary padding. |
| A line without a valid non-negative number | Skips that line rather than breaking the chart. | Correct or remove the row before downloading. |
| A category label containing a comma | Reads the value from the last comma on the line. | Place the complete label before the final numeric value. |
| A value of zero | Accepts it, although the corresponding slice has no visible width. | Do not expect a visible segment for a zero-valued category. |
| Whole numbers or decimals | Accepts either numeric form. | Enter only the number after the final comma. |
You can paste text rather than type every row, but the pasted content still needs the supported structure. Labels are read up to the last comma, which allows category names containing commas. For the most predictable result, keep the final item on each line strictly numeric and avoid adding units or notes after it.
Read the legend and percentages
You do not need to calculate shares by hand. Each slice is sized according to its proportion of all valid values:
Percentage = value ÷ sum of all valid values × 100
Using the two-row example above, the total is 63 + 20 = 83. Chrome’s share is 63 ÷ 83 × 100, or approximately 75.9%, while Safari’s share is 20 ÷ 83 × 100, or approximately 24.1%. The same proportional calculation determines the size of each slice.
The preview gives you several pieces of information at once:
| Chart element | What it provides |
|---|---|
| Colored slice | Shows the category’s share of the total. |
| Legend | Lists each label with its raw value and percentage. |
| Optional title | Appears above the chart to describe the whole. |
| Downloaded PNG | Provides a white-background image with crisp edges for reuse outside the browser. |
Improve the chart’s readability
A technically correct pie can still be difficult to interpret when it contains too many categories or unclear labels. A few formatting choices can produce a cleaner result without changing the supported workflow.
- Keep the number of slices small. When many categories are close in size, group the least important ones into an “Other” row.
- Order rows from largest to smallest. Slices begin at the top and follow the order in which you list them, so sorting the values can create a more deliberate layout.
- Use short labels. Concise names keep the legend tidy and make the image easier to scan at presentation size.
- Describe the complete dataset in the title. A title such as a report name, budget period, or survey subject gives the pie context without crowding individual labels.
- Check zero-valued entries separately. They are accepted, but a zero produces no visible slice width.
After making a readability adjustment, watch the chart redraw and inspect the legend before downloading. Because the chart updates immediately, you can refine the input without rebuilding the image manually.
Download the PNG for Mac documents and slides
Once valid data has produced a chart, a download link appears. Click Download to generate the PNG on your device. The browser uses its normal download process, so the image appears in the usual Downloads location where you can locate it in Finder.
- Click Download in the Pie Chart Maker. Confirm that the live preview contains the expected categories and percentages first.
- Locate the PNG in your Mac’s Downloads folder. Open Finder and look for the newly downloaded image.
- Move or rename the file if needed. Give it a descriptive name that will be recognizable in your working folder.
- Insert it into your destination. Open the relevant Mac document or slide deck and use its image-insertion command to select the PNG. Exact menu names can vary by application.
The supported export is a flat PNG image, not an editable chart embedded in Pages, Keynote, Numbers, Excel, PowerPoint, or another native document. If those applications need an editable object, use their own charting features; use this maker when a ready-to-place PNG is the desired result.
Understand privacy and practical limits
The chart is drawn on an HTML canvas inside your own browser tab, and the PNG is generated locally on your Mac. Your data is never sent anywhere, so internal metrics, budgets, survey results, and other confidential figures do not need to be uploaded to a remote service. Redraws also happen without a network round-trip.
- Browser-based operation: The tool runs in a browser rather than as a standalone macOS application, and there is no account or installation.
- PNG output only: The documented download format is a PNG image. Native document editing is outside the maker’s workflow.
- Simple list input: Each category must resolve to a label and a valid non-negative numeric value.
- Invalid rows are skipped: A malformed line does not prevent other valid rows from forming a chart, but it may mean that an intended category is absent.
- Zero is accepted: Its slice has no visible width, so use the legend and raw values when zero categories matter.
For a Mac user who needs a quick, private, shareable chart, the supported path is straightforward: enter or paste the rows, review the live slices and legend, add a title if useful, and download the PNG.
For a deeper look, see What to Do When Bored on Mac: Clear Ideas Fast.
For a deeper look, see Fix Wrong Results in a Table Chart CSV Table Maker.