Document a Line Graph Maker workflow in four checkpoints: input, generation, verification, and export. Keep the written record beside the original dataset so a reader can distinguish the intended sequence, the values actually plotted, and any rows that were skipped.
What your workflow record should contain
A complete procedure should state what the chart represents, which inputs were submitted, what the maker displayed, and which file was released. Put those details in a text note, project record, or analysis log; the exported SVG is the chart, not a complete audit trail.
| Record area | What to write | Why it matters |
|---|---|---|
| Source and purpose | Dataset or file, date, intended comparison, and measurement context | Preserves the reason the chart was created |
| Title and input | Exact chart title and Label, Value rows in submitted order | Shows what readers saw and how points were sequenced |
| Validation | Invalid-row count, over-limit count, and displayed axis range | Explains skipped data and the visible scale |
| Output | SVG filename, export date, and any later editing | Connects the published chart to a specific version |
State the unit and other measurement context in your notes so they are not lost when the graph is separated from its source. Retain the original dataset because the chart is a visual representation, not a replacement for the measurements.
Prepare valid Label, Value rows
Enter one point per non-empty line using the format Label, Value. The final comma on each line separates the label from the number, so a label can contain an earlier comma. For example, these rows are formatted correctly:
- Launch, 14
- Review, 19
- Release, 11
Values may be positive, negative, zero, decimal, or written in scientific notation. Empty labels, malformed numbers, Infinity, and magnitudes above 1e12 are invalid. Blank lines are ignored, but they do not count as points. At least two valid points are required because one point cannot form a line segment.
The maker accepts up to 50,000 UTF-16 code units of input and processes at most 200 non-empty rows for one chart. Invalid processed rows and rows beyond the processing limit are counted separately and reported beside the result. Keep the submitted rows in your notes so those counts can be reconciled with the source.
Document the graph-making steps
- Create a record header. Write the chart’s purpose, source, date, intended sequence, and unit before entering any data. This prevents a later reader from confusing the chart’s order with an implied timeline.
- Prepare the rows in the intended order. Put one Label, Value pair on each line and use the final comma as the separator. The maker does not sort rows, so arrange them before generating the chart.
- Enter the title and data. Add a concise chart title and the prepared rows in the Line Graph Maker. Keep the exact submitted block with the documentation so the input can be reproduced.
- Generate the graph and inspect the result. Review the displayed vertical-axis range and look for any explicit invalid-row or over-limit notice beside the chart.
- Resolve reported problems and regenerate. If rows were skipped, correct the listed input problem and generate again. Make sure at least two valid points remain. A skipped-row notice does not necessarily mean the entire chart failed.
- Verify the plotted order and values. Check the title, the left-to-right row order, and every visible point. Hovering or focusing through an SVG-aware viewer may expose a point title containing its label and formatted value.
- Record the scale and interpretation. Write down the displayed minimum and maximum, note any skipped rows, and avoid adding conclusions the observations do not establish.
- Download and identify the SVG. Download the standalone SVG only after the checks are complete. Record its filename and keep it with the source data and written procedure.
Record order and scale without overstating the data
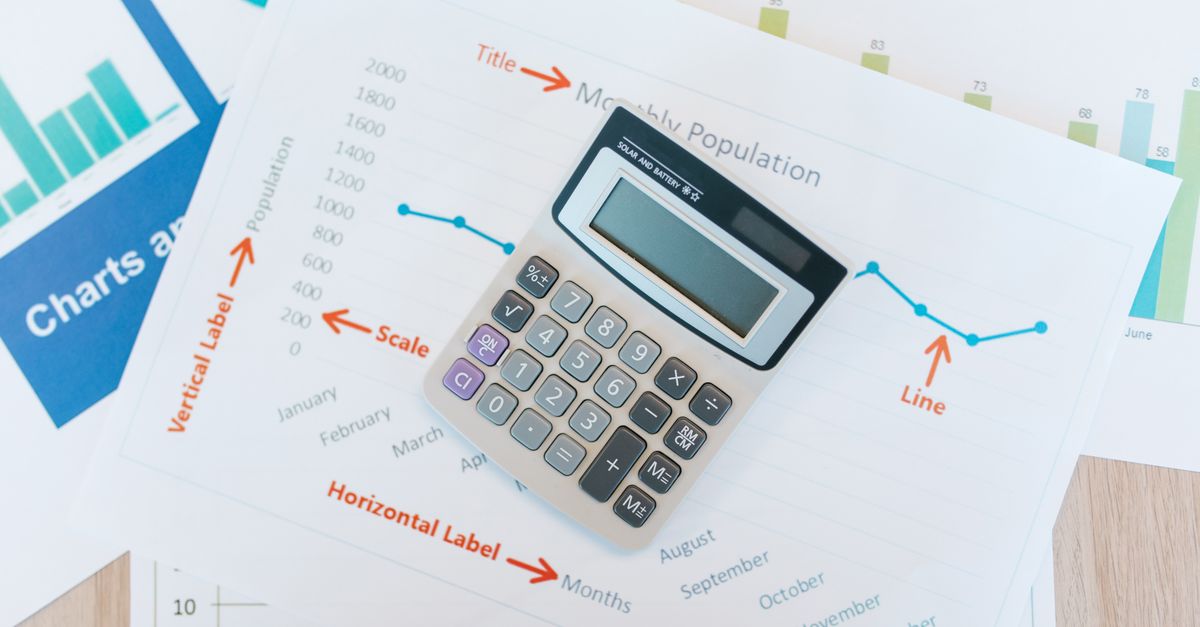
Horizontal positions are equally spaced according to row order. The first valid point appears at the left edge of the plot and the final valid point at the right edge. Labels are not interpreted as dates, categories with measured distances, or numeric x-coordinates. This works well for an ordered categorical sequence such as consecutive months, but it does not preserve irregular gaps.
The vertical axis uses a linear scale from the smallest entered value to the largest. The minimum maps to the bottom and the maximum to the top, with intermediate values placed proportionally between them. When every value is identical, the maker expands the domain around that constant so the line remains visible in the middle. The axis does not automatically start at zero, so record the displayed labels rather than assuming a baseline.
Connecting observations shows sequence and direction; it does not prove that the underlying process changed smoothly between measurements. The maker does not calculate a regression, forecast, moving average, confidence interval, statistical significance, error bars, or missing-value interpolation. A clear procedure note should identify the line as a connection between supplied observations rather than a statistical model.
Match the method to the spacing of your data
| Data situation | Line Graph Maker behavior | Documented choice |
|---|---|---|
| Ordered categorical sequence | Places points at equal horizontal intervals in entered order | Suitable when sequence matters but spacing does not |
| Irregular time gaps or measured x positions | Still spaces points equally and does not read labels as x-values | Use a plotting or spreadsheet application with explicit x and y columns |
| Every value is identical | Uses an expanded symmetric vertical domain | Suitable, but record the displayed axis labels |
Choose the maker for ordered sequences in which equal horizontal spacing is appropriate. Choose an application that accepts explicit x and y columns when calendar gaps, elapsed time, or physical distance must remain proportional. Do not compress or relabel the source data simply to make it fit the maker’s equal-spacing model.
Capture output and source-precision details
Parsing, coordinate calculation, preview rendering, and SVG creation all happen in the current browser. The entered text is not uploaded to Lizely. Record that handling method when your procedure needs to explain where the chart was produced and whether the source data left the browser.
The download is a standalone SVG containing the chart title, axes, horizontal grid lines, labels, connecting line, point markers, and accessible point titles. It remains sharp when resized or printed and can be opened in modern browsers or imported into many document, presentation, and design applications. For background on the format, see the MDN SVG tutorial.
Keep the original dataset when exact precision, uncertainty, or auditability matters. The maker uses standard JavaScript double-precision arithmetic, and rounded axis labels may be shorter than the full internal number; the chart does not add measurement accuracy or decimal precision. If a publication needs a particular palette, typography, accessibility treatment, or print standard, edit the SVG in an appropriate vector tool and record those changes.
Maintain a versioned procedure note
Treat each change to the source data as a new documented version. Record which rows were added, removed, or reordered; whether the invalid-row or over-limit counts changed; the new displayed vertical range; and the replacement SVG filename. If the title or data is edited, the generated output is cleared and the download is disabled until the graph is generated again. If generation fails after an earlier successful chart, the earlier output is cleared rather than left on screen.
A compact reusable note can read: “Entered [chart title] with [row count] Label, Value rows in the submitted order; generated on [date]; invalid rows skipped: [count or notice]; over-limit rows skipped: [count or notice]; displayed vertical range: [minimum] to [maximum]; exported [SVG filename].” Replace every bracket with the value shown by the tool, and attach the source-data snapshot and final SVG.
Related reading: Mind Map Maker on Windows: Turn Notes into an SVG.
Related reading: Random Date Generator Large Text: A Display Workflow.