A line graph maker is the right approach when you have a small ordered sequence (up to 200 non-empty rows) and want to show how each value changes in entry order, producing a standalone scalable SVG that you can open, edit, or embed without uploading any data. The choice starts with matching the chart type to the shape of your numbers: a line graph is correct when showing direction across an ordered sequence matters more than comparing category sizes, and it is the wrong choice when the horizontal axis represents measured distance, when time gaps between observations are uneven, or when every observation is its own discrete bucket. Once the chart type is settled, prepare your input as Label, Value pairs with the last comma on each line acting as the separator so labels can still contain earlier commas. Generate the plot, read the axis range labels and any skipped-row notice the tool displays, then verify the order of points before exporting. The whole process (parsing, coordinate calculation, preview rendering, and SVG download creation) runs locally in the current browser, so the text you type never leaves your machine.
Match the Chart Type to the Question You Are Asking
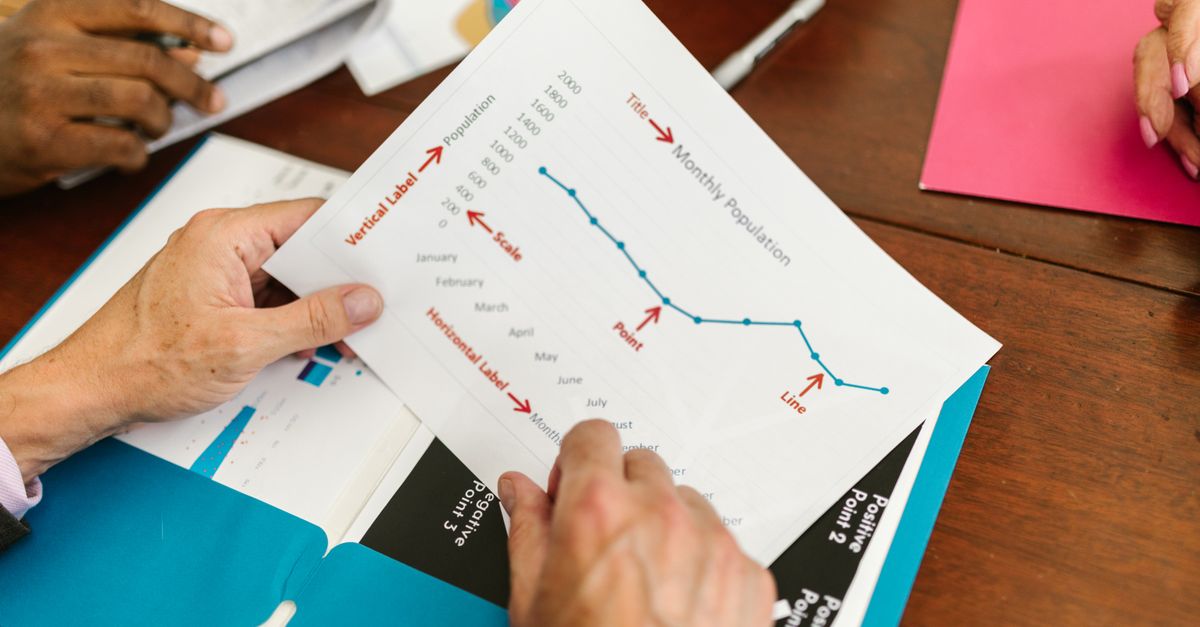
The first decision has nothing to do with the tool itself; it is about the relationship among your numbers. A line graph connects adjacent points to emphasize how a sequence moves (up, down, peak, valley, plateau). That visual only earns its keep when the points have a real order and your reader cares about the direction of change. When the order is irrelevant or the gaps between observations are uneven, the connecting line becomes a misleading artifact because it implies smoothness or distance that is not actually present in the underlying data.
Use a line graph when you have an ordered categorical sequence (months of the year, experiment trials in order, sprint numbers, project phases) and the reader's question is "what direction is this moving?". Use a bar chart when the reader's question is "which category is largest?". Use a pie chart when the question is "what share does each part contribute to a whole?". Use a scatter plot when the horizontal axis is itself a measured numeric value and you need to preserve the actual distance between points rather than rely on entry order.
| Question being asked | Best chart type | Why this shape fits |
|---|---|---|
| How does an ordered sequence change across points? | Line graph | Connecting adjacent points reveals direction and trend. |
| Which category is largest? | Bar chart | Bar length makes magnitude comparisons direct. |
| What share of the whole does each part contribute? | Pie chart | Slices expose part-to-whole relationships at a glance. |
| How does y behave as a measured numeric x changes? | Scatter plot | Horizontal spacing preserves measured distance, not entry order. |
The tool described here (Line Graph Maker) is tuned specifically for the first row of this table. It draws a single line through equal horizontal spacing, places each point at its true vertical position, and exports the result as an open SVG vector file. For the other rows, a different chart tool is the better fit because the visual conventions differ.
Format Your Data So the Parser Reads It Cleanly
The parser follows one simple rule: on every non-empty line, the last comma separates the label from the value. Everything before that final comma is treated as the label, even if it contains earlier commas. So "New York, East" plus a final comma and a number becomes the label "New York, East" rather than getting split into three columns. Blank lines are ignored, which means you can space out your input for readability without producing blank data points.
Values follow standard double-precision arithmetic rules. They may be positive, negative, zero, decimal, or written in scientific notation (for example 1.5e3). Empty labels, malformed numbers, the value Infinity, and magnitudes above 1e12 are rejected as invalid. The tool counts invalid rows and any rows processed beyond the 200-row chart cap separately, then surfaces those counts beside the result so you can see exactly what was kept and what was dropped.
| Input pattern | Status | What happens |
|---|---|---|
| January, 12 | Valid | Label = January, value = 12, point plotted in order. |
| New York, East, 4 | Valid | Label keeps the embedded comma because only the last comma is the separator. |
| , 7 | Invalid | Empty label; row is skipped and counted. |
| Sample A, abc | Invalid | "abc" is not a finite number; row is skipped and counted. |
| Peak, Infinity | Invalid | Infinity is not finite; row is skipped and counted. |
| Huge, 5e15 | Invalid | Magnitude above 1e12 is rejected; row is skipped and counted. |
A second safeguard protects browser responsiveness: input is capped at 50,000 UTF-16 code units, and only the first 200 non-empty rows are used for the chart. If you exceed either limit, the parser still surfaces the rejected count in the notice area so you can adjust your input. At least two valid points are required, because a single point cannot draw a line segment.
Generate the Chart in a Clear Sequence
With the chart type chosen and the input formatted, the build itself is a tight sequence of four actions. Each step has a visible result on screen, so you can stop and review at any point before exporting.
- Enter a concise chart title that names the variable and the unit (for example, "Monthly active users" or "Daily temperature, Celsius").
- Add at least two rows in Label, Value format, one observation per line, ordering them from earliest to latest.
- Generate the graph, then inspect the axis range and any explicit invalid-row or over-limit notice the tool displays.
- Verify the plotted order and values, then download the standalone SVG file.
Editing the title or the data afterward clears the previous chart and disables the download button until you generate again. That behaviour keeps the on-screen chart and the exported file in sync, so you cannot accidentally ship a graph whose data no longer matches what you typed. If generation fails after a successful chart, the earlier output is also cleared rather than remaining on screen as if it represented the new input.
Inspect the Output Before You Trust the Download
Generation is not the same as verification. The vertical axis uses a linear scale running from the smallest entered value to the largest, not from zero, which means the apparent slope of the line can exaggerate or flatten the real change. Always read the y-axis tick labels before judging how dramatic a swing looks on screen. Five horizontal grid lines and matching axis labels expose the displayed domain so the reader can ground the visual to actual numbers. Axis labels retain practical significant digits and use scientific notation for very small or very large values, which is suitable for ordinary visualization but does not add measurement accuracy beyond the source data; keep the original dataset when exact source precision or auditability matters.
Horizontal spacing is also worth knowing. Points are placed in entry order at equal horizontal intervals, with the first valid point at the left edge of the plot and the final valid point at the right edge. This is appropriate for an ordered categorical sequence such as January through May. It is the wrong choice when you need to preserve measured time gaps (hourly data with missing hours, monthly snapshots across uneven calendar spacing) or true numeric x coordinates. For those cases, switch to a tool that accepts explicit x and y columns, such as the XY scatter plot maker.
Two edge cases are handled explicitly. When every valid value is identical, the tool expands a symmetric domain around that constant so the line still has a visible position in the middle of the plot rather than collapsing onto a single pixel. If you hover or focus a point in an SVG-aware viewer, the point title surfaces the original label and its formatted value, giving you a round-trip read of the data without leaving the page. Long labels can crowd the horizontal axis on narrow screens, so shorten labels or use fewer points if readability matters; the exported chart keeps a stable 800 by 480 viewBox so a small device preview may scroll horizontally.
Decide Where the Downloaded SVG Belongs Next
The export is a standalone SVG file: an open vector format that stays sharp when resized or printed and that includes the chart title, axes, horizontal grid lines, labels, connecting line, point markers, and accessible point titles as part of the document. The preview you see and the file you download are produced from the same deterministic layout, so what looks correct on screen is what lands in the file. The SVG uses a white background and a blue line for broad compatibility; if a publication requires a specific brand palette, typography, or accessibility treatment, open the file in a vector editor after export. The structural building blocks (viewBox, axes, paths, and titles) follow the same conventions described in the MDN SVG tutorial.
Because parsing, plotting, preview rendering, and SVG creation all happen locally in the current browser, the numbers you typed are never sent to a server. That makes the approach well suited to draft work, classroom examples, simple performance reports, and quick check-ins where the output goes into a slide deck or a doc rather than a final published chart. For charts that need to argue for a specific causal story, regression, forecast, confidence interval, or statistical significance, treat the line only as a sequence visualization and use a statistics package for the underlying analysis. A line between two measurements does not establish that the real process changed smoothly, and the tool does not calculate a regression, moving average, missing-value interpolation, or any error bar.
If you're weighing options, Mind Map Maker on Android: Works in Your Mobile Browser covers this in detail.
If you're weighing options, How Do I Compare Scatter Plot Maker Approaches? covers this in detail.