You need a line graph only when each numeric value belongs to an ordered sequence and connecting the points helps readers see direction or change. That is the core decision when using Line Graph Maker: it visualizes a small sequence of labeled numbers, not every possible data set. Name the question your chart must answer before deciding on the chart form.
Start with the question the chart must answer
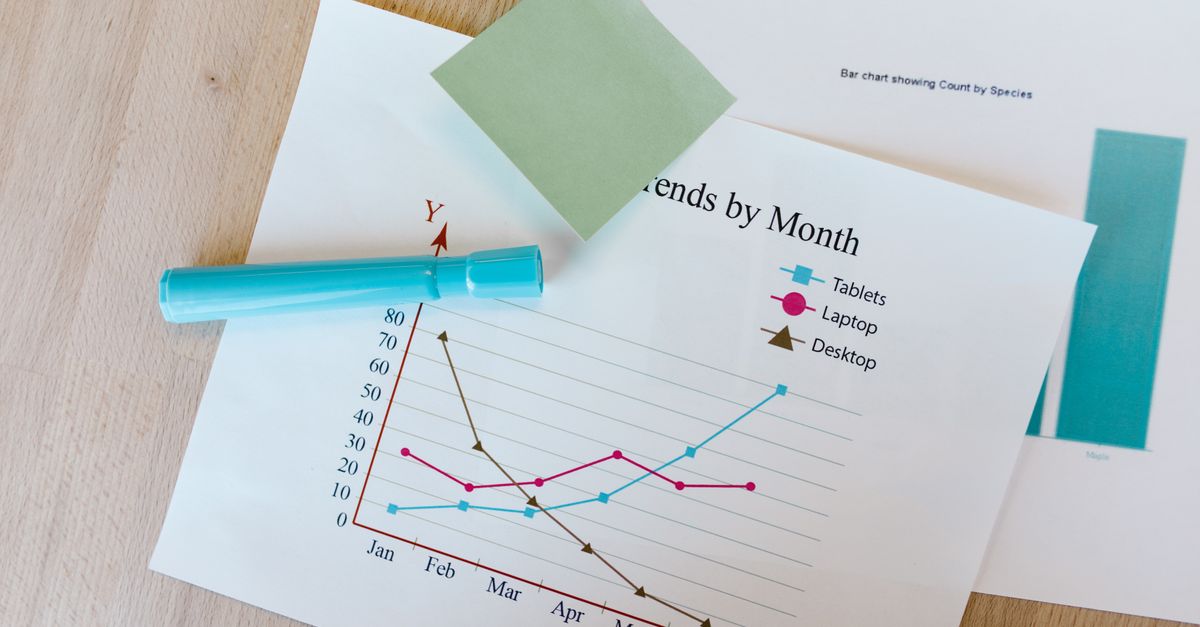
A line graph is useful when order matters. Monthly totals from January through May, readings taken at ordered checkpoints, and progress recorded at successive stages all give the line a meaningful path. The connected points make rises, falls, and overall direction easier to see than a list of values by themselves. That is especially helpful when the reader’s question is “How did the value change as the sequence progressed?”
The key is not simply having several numbers. Decide whether the path between adjacent observations tells the reader something relevant. If the rows are unrelated products, departments, or scores and you only need to compare their sizes, a line may imply a relationship or progression that is not there. In that case, compare categories with bars or show exact values in a table.
Use a line graph only when row order carries meaning
Line Graph Maker uses row order as the horizontal structure. Labels appear from left to right in the order entered, and valid points are spaced equally; the labels are not interpreted as dates, categories with measured distance, or numeric x coordinates. A January-to-May sequence can therefore fit this model when each step should receive equal visual weight. It does not fit if gaps between observations matter, such as measurements taken at irregular intervals.
The tool also does not sort your rows. If the intended chronology differs from the pasted order, the graph will be wrong in a way that may look plausible. Arrange the data deliberately before generating it. A line also shows a sequence, not a causal mechanism; the visual connection cannot prove that one observation caused the next.
Match the data shape to the right chart
Use the chart that matches the comparison, not the chart that looks most familiar.
| Your main question | Best fit | Why |
|---|---|---|
| How did the value change through ordered steps? | Line graph | Connecting positions emphasizes direction and change. |
| How do independent categories differ? | Bar chart | Separate bars focus attention on magnitude comparison. |
| How do two measured variables relate? | XY scatter plot | Explicit x and y coordinates preserve the relationship. |
| What is the exact value for each item? | Table | Lookup precision matters more than a visual trend. |
| Do observations occur at unequal x positions? | Plotting or spreadsheet tool with x and y columns | Equal row spacing would not preserve the measured distances. |
This exposes an important limitation: Line Graph Maker accepts one value plus an ordered label, so it can show sequence but cannot preserve a measured horizontal coordinate. If elapsed days, distances, or another uneven x scale carry meaning, move to an application that accepts explicit x and y columns. Do not treat the maker’s equal spacing as a claim that every interval lasted the same amount of time.
Keep your conclusion proportional as well. A line is reasonable for showing observed direction, but it is not a substitute for analysis when you need statistical inference, uncertainty, or a forecast. If those are the real task, use an appropriate analysis workflow rather than treating the visual trend as the finding.
Check the maker’s limits before entering the full dataset
Before entering a full data set, check whether it can be plotted without losing information.
- Data format and valid points: Enter one point per non-empty line as Label, Value. The final comma separates the label from the number, so a label may contain an earlier comma. Values may be positive, negative, zero, decimal, or scientific notation. Empty labels, malformed numbers, Infinity, and magnitudes above 1e12 are invalid. At least two valid points are required because one point cannot form a line segment.
- Row and input limits: The maker processes at most 200 non-empty input rows. Invalid rows among the processed rows are skipped and counted, while additional rows beyond that limit are counted separately as over-limit. The whole input is also limited to 50,000 UTF-16 code units. Blank lines are ignored.
- Order and spacing: The first valid row appears at the left edge, the last at the right, and intermediate points are evenly spaced by row order. That is suitable for an ordered categorical sequence, but not for unequal time gaps or measured distances.
All parsing, plotting, preview rendering, and SVG creation happen in the current browser, and the text entered is not uploaded to Lizely. These checks matter before presentation because skipped rows or a misleading axis can change the story the chart appears to tell.
Create the graph in the order you intend to publish
- Enter the title and data. Add a concise chart title and at least two rows in Label, Value format. Make sure the rows are already in the intended sequence. The title, labels, and values in the preview should match the wording you intend to publish.
- Generate and inspect the result. Generate the graph, then examine the vertical axis range and read any explicit invalid-row or over-limit notice. The axis is linear from the smallest valid value to the largest, so it does not automatically begin at zero. Correct listed input problems and generate again rather than accepting an unexplained skip.
- Verify the plotted order and values. Read the labels from left to right, compare every visible point with your source data, and check the title and displayed axis labels. Hovering or focusing through an SVG-aware viewer may expose each point’s label and formatted value. Because displayed text can be rounded, keep the original dataset when exact precision matters.
- Confirm the output is current. If generation fails after a previous successful chart, the earlier output is cleared. Editing the title or data also clears the generated chart and disables the download button until you generate again. This prevents an old preview from being mistaken for the revised input.
- Download the standalone SVG after the checks pass. The export includes the title, axes, horizontal grid lines, labels, connecting line, point markers, and accessible point titles. It stays sharp when resized or printed and can be opened in modern browsers or imported into many document, presentation, and design applications. The standard export uses a white background and blue line; edit the vector file afterward if a publication requires a specific palette, typography, accessibility treatment, or print standard.
Read the result without overstating what it proves
A final line graph can be mechanically correct and still invite an inaccurate conclusion. The connected segments describe the observations you supplied; they do not prove causation, establish that the underlying process changed smoothly between readings, or fill in missing values. The maker does not calculate regression, forecasts, moving averages, confidence intervals, statistical significance, error bars, or missing-value interpolation. It also does not add measurement accuracy or decimal precision to source data. When exact source precision, uncertainty, or auditability matters, retain the original dataset and use the appropriate analysis workflow.
If every value is identical, the tool expands the vertical domain around that constant so the line remains visible in the middle. This avoids a zero-range display, but it also means you should read the axis before judging the apparent height or change.
Use a final go/no-go checklist
Before you make the final call, answer these points:
- Can you state the reader’s question as change across an ordered sequence?
- Are all rows in the intended order, and is equal spacing honest for this data?
- Are there at least two valid points, with every skipped row accounted for?
- Do you understand the displayed minimum, maximum, and whether the axis starts at zero?
- Will you describe only observed direction, without implying causation or precision the data cannot support?
- Will the standalone SVG meet the destination’s format and styling needs?
If either of the first two answers is no, a line graph is the wrong choice. If they are yes and the remaining checks pass, Line Graph Maker is suitable for a clear, scalable sequence graphic. If the x positions are unequal, use an explicit x-and-y plotting or spreadsheet workflow; if the task needs statistical inference, use an analysis workflow designed for it.
For a deeper look, see Mind Map Maker on Mac: Build an SVG from an Outline.
For a deeper look, see Pie Chart Maker on Android: Make a PNG in Your Browser.