Line Graph Maker accepts up to 200 labeled numeric rows in a strict "Label, Value" format and exports the chart as a standalone SVG that stays crisp at any zoom level. The parser uses the final comma on each non-empty line as the separator, so a label like "New York, East" remains intact while the trailing portion becomes the y-value. Numbers can be positive, negative, zero, decimal, or written in scientific notation; empty labels, malformed numbers, Infinity, and magnitudes above 1e12 are skipped and counted separately beside the result. The vertical axis is a linear scale from the smallest valid to the largest valid value, and the horizontal axis spaces labels equally by row order rather than by date or measured distance. Everything—parsing, coordinate calculation, preview rendering, and SVG file creation—runs in the current browser, so the source rows never leave the machine. This is the practical alternative when you need a portable, vector-quality chart from a small dataset without fighting Excel's built-in chart wizard, installing an add-in, or sharing the workbook with collaborators just to let them view the chart.
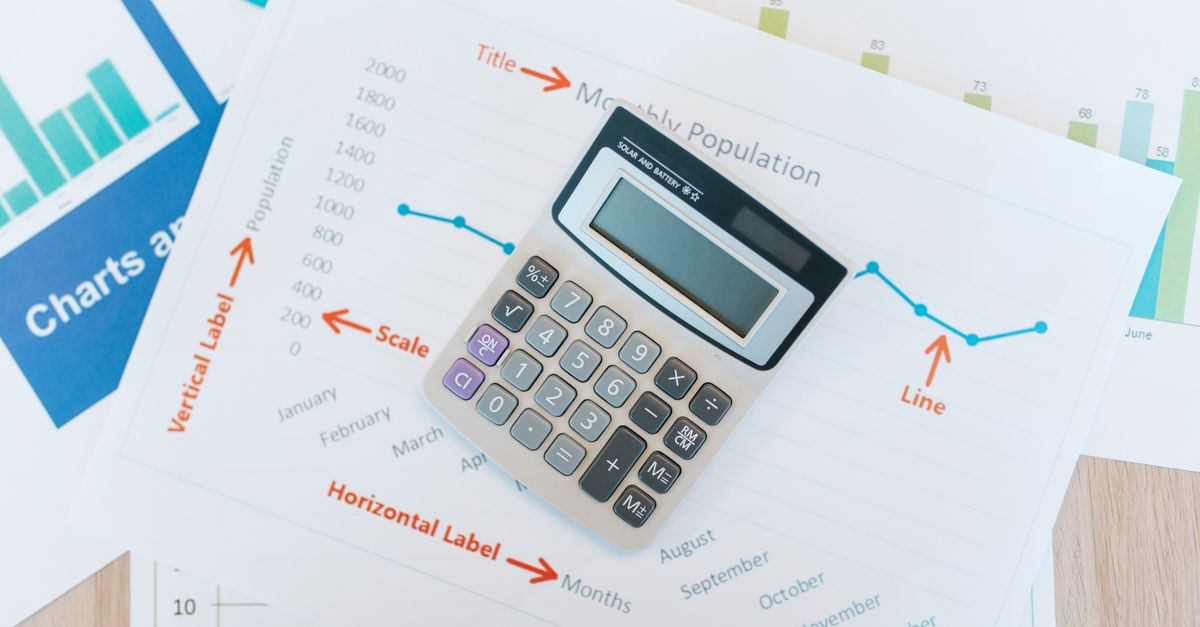
Comparing the Line Graph Maker to Excel's Native Chart Workflow
Excel's chart wizard is convenient when the dataset already lives inside the workbook, the formatting controls are sufficient, and the recipient will open the file in Excel. The Line Graph Maker fills a different gap: small ordered datasets that need to leave Excel as a self-contained vector image, especially when the chart must look identical in a browser, a PDF, a slide deck, or printed output. Because the SVG is generated from the same code that draws the on-screen preview, what you see is exactly what downloads—no surprise formatting drift between the editor and the export.
| Aspect | Excel native chart | Line Graph Maker |
|---|---|---|
| Processing location | Inside the workbook, on the user's machine | Inside the browser, on the user's machine |
| Output file | Embedded chart object inside the workbook | Standalone SVG image |
| Maximum rows per chart | Limited by Excel's data range limits | 200 non-empty rows, with over-limit count reported beside the result |
| Skipped-row handling | Errors stop the chart from rendering | Invalid rows counted and reported beside the result |
| Scales for print or projection | Pixels inside a worksheet, can blur when scaled up | Vector format that stays sharp at any size |
| Data privacy | Stored inside the workbook file | Never leaves the browser |
For datasets larger than 200 rows, or for charts that need unequal x-spacing, explicit date parsing, or trendlines, Excel's native chart or a dedicated plotting application is the better tool. For anything smaller and ordered, exporting through the browser keeps the workflow simple and the file portable.
Format Your Excel Rows as Label, Value Pairs
The parser has one rule: on every non-empty line, the last comma separates the label from the value. That single rule means you do not have to clean labels that already contain commas, such as city-and-region pairs. To prepare a worksheet for paste, arrange the data so each row holds one label and one number, then export just those two columns. If the worksheet currently shows labels in column A and values in column B, copy that range, paste it into a plain text editor, and let the tool rejoin the columns with commas—Excel will quote fields that contain commas itself, which can break the parser.
| Input example | Status | Reason |
|---|---|---|
| Jan, 142 | Accepted | Final comma cleanly separates label and positive integer |
| New York, East, 87 | Accepted | Last comma separates "New York, East" from 87; earlier comma is part of the label |
| -3.4e2, -340 | Accepted | Scientific notation and negative value are both valid |
| Q4, | Skipped | Empty value, malformed number |
| Peak, Infinity | Skipped | Infinity is explicitly rejected by the parser |
| Reading, 5e15 | Skipped | Magnitude above 1e12 is rejected by the parser |
Once the rows are formatted, the chart title sits above the dataset and describes what is being plotted—monthly total, daily visitors, weekly temperature, experiment reading. A concise title helps the reviewer interpret the vertical scale at a glance, and because the title field is regenerated every time the chart is built, the title can be revised without touching the data.
Build the Line Graph in Three Steps
The workflow from a populated Excel range to a downloaded SVG takes three deliberate steps, and every step has a built-in safeguard against silent mistakes.
- Enter a concise chart title in the title field, then add at least two rows in "Label, Value" format. Each row contributes one point on the line, and a single point cannot form a line segment, so the minimum is two valid rows.
- Generate the graph and read the axis range plus the explicit skipped-row and over-limit notices. If the notice shows non-zero counts, fix those rows before continuing—the chart you see is the chart that will be exported.
- Verify the plotted order, axis labels, and every visible point against the source data, then download the standalone SVG.
A few details worth knowing during this sequence. The download button stays disabled until the chart has been generated, and editing either the title or the data clears the previous output—so the visible chart always matches the visible input. If generation fails for any reason after a previous chart rendered, the older output is cleared instead of staying on screen and misrepresenting the new input. The same deterministic layout feeds the on-screen preview and the downloaded file, which means the exported SVG matches the preview inside the 800 by 480 viewBox. Editing the SVG later in a vector editor is straightforward because the file is plain XML.
Reading the Axis, Skipped Rows, and the 200-Row Ceiling
The vertical axis uses a linear scale from the smallest entered value to the largest entered value, with five evenly spaced reference lines and axis labels exposed so the displayed domain is never hidden. When every value is identical, the domain is expanded around that constant so the line stays visible in the middle of the plot rather than collapsing onto a single edge. The axis does not always start at zero, so the apparent size of a change depends on which numbers you read off the y-axis—inspect the labels before judging the magnitude.
The tool processes at most 200 non-empty rows in one chart to keep the browser interaction responsive. Anything above that limit is counted and reported separately from malformed rows, so it is easy to see whether the gap is a formatting problem or a size problem. Empty lines are silently ignored, and the input itself is capped at 50,000 UTF-16 code units—plenty for a chart but a hard wall before the parser starts. Numbers are handled with standard JavaScript double-precision arithmetic, and axis labels use scientific notation for very small or very large values, which can shorten the displayed text relative to the internal number.
Bring the Exported SVG Back into Excel or Office Documents
The downloaded SVG opens directly in any modern browser, which is the fastest way to confirm it matches the intent. To insert it into Excel, Word, or PowerPoint, use the Insert > Pictures > This Device menu and select the SVG file; Office treats it as a vector image and renders it without the blur of a pasted screenshot. Because the file is standalone, it carries its own white background, blue line, axis labels, grid lines, and point markers, and does not reference any external font or stylesheet.
If the publication requires a specific brand palette, custom typography, or print standard, edit the SVG in a vector tool such as Inkscape or Illustrator after export. The structure is plain XML, and the MDN SVG tutorial walks through the elements that drive the visible output. The W3C SVG 2 specification covers the same elements in normative detail if a deeper reference is needed.
When a Line Graph Is the Wrong Choice
A line between two points shows sequence and direction, not proof of causation or values between observations, so connecting measurements that should not be connected can mislead the reader. If the x-axis represents unequal time gaps—such as daily readings on weekdays only, or measurements taken on irregular dates—equal spacing will distort the apparent slope. For that case, a scatter plot with explicit x and y columns or a dedicated plotting application that interprets dates is the better choice, and the related XY Scatter Plot Maker handles that exact shape with x,y rows.
The Line Graph Maker does not calculate a regression, forecast, moving average, confidence interval, statistical significance, error bar, or missing-value interpolation, and it does not sort rows automatically. Arrange the input in the intended order and avoid presenting the line as evidence beyond the observations supplied. Hovering or focusing through an SVG-aware viewer exposes each point title with its label and formatted value, which helps screen readers and reviewers confirm the values without exporting the dataset. If exact source precision, uncertainty, or auditability matter, keep the original dataset alongside the exported chart.
Bookmark the Tool for the Next Small Dataset
The Line Graph Maker sits at /generators/line-graph-maker/—worth bookmarking for the next time a colleague asks for a quick chart from a small spreadsheet. Because everything runs in the browser, it works on a locked-down work laptop without installation, on a Chromebook without Office, and on a shared kiosk without exposing the dataset to a third-party server. The same input rule—final comma splits label from value—keeps the workflow predictable across datasets, and the explicit skipped-row and over-limit notices mean the visible chart always represents what the parser actually accepted.
If you're weighing options, How to Generate Random Letters in Excel Without a Formula covers this in detail.
If you're weighing options, How to Generate Random Numbers in Excel: 3 Methods covers this in detail.