A tip calculator chart is a reference table that pairs common bill amounts with the tip due at standard rates — usually 10%, 15%, 18%, 20%, and 25% — so you can read off the right gratuity in a single glance. The chart works by applying one fixed equation to every cell: tip = bill × (percentage ÷ 100), with the grand total equal to the bill plus the tip and the per-person share equal to the total divided by the number of diners. Because the math is the same at every amount, a chart is really a shortcut — a visual layout that spares you from doing the multiplication in your head while the waiter waits. The Tip Calculator builds that chart dynamically: type in any bill, choose a percentage from a quick-select button or type your own, set the number of people, and the chart's three numbers — tip, total, per-person share — appear instantly, accurate to the cent, with no rounding applied until the display step. Everything runs locally in your browser, so the calculation happens on your device without sending your bill to any server, account, or analytics tool.
What a Tip Chart Actually Shows
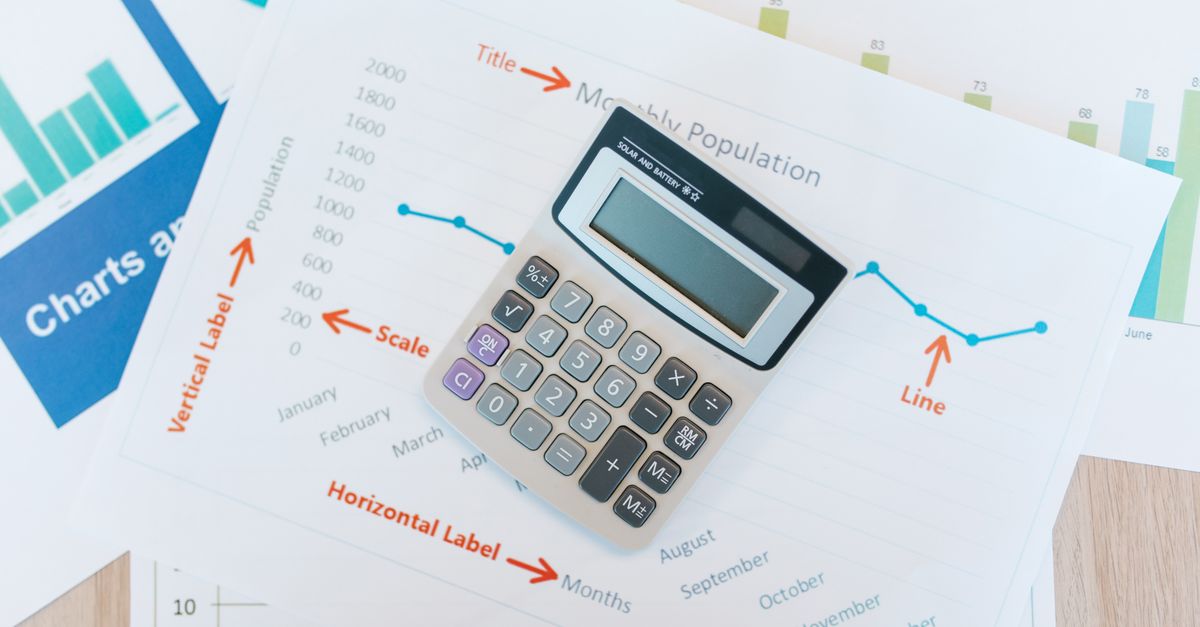
A traditional tip chart is laid out as a grid: bill amounts run across the top in fixed increments ($25, $50, $75, $100, and so on), the tip percentages run down the side, and the intersection of any row and column shows the tip due for that combination. Print versions of these charts used to live on restaurant walls or inside tip-tray holders. The same idea continues in digital form on tip-calculator websites, where the chart is generated on demand instead of pre-printed.
A static chart has limits. It only shows the bill amounts the publisher chose to include, and only at the percentages they decided to display. Ask for $73.42 at 17% and you are back to doing the math by hand. A dynamic chart, by contrast, treats the percentage and the bill as variables and recalculates every cell the moment you change either input. That is exactly how the Tip Calculator behaves — the chart rebuilds itself with each keystroke rather than waiting for you to find the right row.
Standard Tip Rates by Service Type
Before a chart can be useful, you need to know which percentages are worth filling in. The standard rates below are a US-centric baseline rather than a hard rule, and they form the rows that any tip chart should cover.
| Service Type | Standard Tip |
|---|---|
| Sit-down restaurant (adequate service) | 15% |
| Sit-down restaurant (good service) | 18–20% |
| Sit-down restaurant (exceptional service) | 25% or more |
| Counter service / takeout | Around 10%, or no tip |
| Bar tab | $1–2 per drink, or 15–20% of the tab |
| Delivery driver | 10–15%, or a $3–5 minimum |
In the United States, the standard for sit-down restaurant service is 15% for adequate service, 18–20% for good service, and 25% or more for exceptional service. For counter service and takeout, a smaller tip of around 10% (or none) is common, since there is no table service involved. Bars often see about $1–2 per drink or 15–20% of the tab, and delivery drivers are typically tipped 10–15% or a $3–5 minimum. Norms vary by country, so these figures are a baseline to adapt, not a fixed law.
The percentages in the table are the seeds for a tip chart. Once you pick a service type, you have the row of percentages to apply; once you have a bill, you have the column. The Tip Calculator ships the five most common US percentages — 10%, 15%, 18%, 20%, and 25% — as quick-select buttons, and it lets you type any custom value (12%, 17%, 22.5%) when the situation calls for it.
Using the Tip Calculator as a Live Chart
Turning a static reference chart into a live calculation takes three steps in the Tip Calculator:
- Enter your bill amount in dollars.
- Choose a tip percentage — tap a quick option (10%, 15%, 18%, 20%, 25%) or type a custom value.
- Set the number of people, then read the tip, total, and per-person amounts instantly.
That is the full loop. The output panel shows three numbers in parallel: the tip alone, the grand total with the tip included, and the per-person share, which already includes each person's share of the tip. Because every keystroke updates every output, the chart updates in real time as you adjust the bill or the percentage. There is nothing to save, nothing to load, and no account is involved — the page is ready the moment it loads.
If you want to check a bill at several rates — say, what 15% versus 20% would actually look like — you only need to tap each quick-select button in turn. The tip, total, and per-person figures all refresh in place. The same trick works for testing different group sizes: change the number of people from 2 to 6 and watch the per-person column drop accordingly.
The Formula Behind Every Cell
Every cell of a tip chart — and every line of the Tip Calculator's output — comes from the same three-line formula:
- Tip = bill × (percentage ÷ 100)
- Total = bill + tip
- Per person = total ÷ number of people
Take a concrete example. Suppose your bill comes to $84.50 and the group agrees that 20% is the right tip:
- Tip = $84.50 × (20 ÷ 100) = $84.50 × 0.20 = $16.90
- Total = $84.50 + $16.90 = $101.40
- Split three ways = $101.40 ÷ 3 = $33.80 per person
That is one cell of the chart at one percentage; running the same formula across other rates fills in the rest of the row. The Tip Calculator runs the formula locally the moment you type, with no rounding applied until the numbers are displayed, so the figures are accurate to the cent. When the per-person share does not divide evenly — a $100 bill split three ways produces repeating decimals — the display rounds each share to the nearest cent. One person can absorb the leftover penny, or the group can round up to a clean number and leave the difference as an extra tip.
Pre-Tax or Post-Tax: Which Goes in the Chart?
A subtler question is which bill figure should be entered into the chart in the first place: the pre-tax subtotal or the post-tax total. Etiquette experts generally agree that tipping on the pre-tax subtotal is perfectly acceptable, because sales tax is not part of the service your server provided. Many people simply tip on the total shown at the bottom of the check for convenience, which results in a slightly larger tip. The Tip Calculator applies your chosen percentage to whatever bill figure you enter, so you stay in control — enter the pre-tax subtotal for a strict tip, or the full total for a rounder number.
For a step-by-step walkthrough of when to use each number, see Calculate Tip Before or After Tax the Right Way. The short version: the chart stays the same shape regardless of which bill you feed in, but the dollar values shift, and the "right" answer depends on whether you want a strict tip or a rounder one. In practice, the difference between the two is usually a dollar or two — enough to matter on a small check but rarely enough to argue over on a large one.
Extending the Chart to Per-Person Splits
Most printed tip charts stop at the tip and total. Splitting the bill is where the Tip Calculator saves the most time. Once you set the number of people, it divides the total evenly and shows the per-person figure to two decimal places. The per-person tip line makes it easy to see how the gratuity alone is shared, which is useful when one person is paying the tip on a card while everyone else covers their food share in cash or via a transfer.
In practice, splitting rarely divides perfectly because real currency does not break into infinite decimals. A $100 bill split three ways produces repeating decimals at nearly any rate, and the calculator rounds each share to the nearest cent. To clean up the small remainder, have one person cover the leftover penny, or round the per-person figure up to a tidy dollar and let the difference become an extra tip for the server. The chart does not need a separate row for each split size — the same percentage produces different per-person values at different group sizes, and the calculator handles all of them on the same screen.
If you would rather skip the arithmetic altogether, the Tip Calculator carries out the same formula each time you change an input, so the chart updates itself. Type in a bill, choose a percentage, set the count, and the tip, total, and per-person amounts are there — accurate, private, and ready before the next course arrives.
Related reading: Tip Calculator Example: From Bill to Per-Person Total.