An exponential moving average (EMA) in Excel is computed with a recursive formula that blends each new price with the previous EMA, scaled by a smoothing factor k = 2 ÷ (N + 1). The opening sentence gives the formula; the rest of this article shows how to lay it out in a spreadsheet, what each cell should contain, and how to verify the underlying decay weights using the Exponent Calculator. EMA reacts faster than a simple moving average because its weights decay geometrically rather than being equal across the window. Today's price carries weight k, yesterday's carries weight k(1 − k), and a price t periods back carries weight k(1 − k)^t. That exponent grows by one with each step back in time, which is exactly the kind of calculation an exponent calculator is built for. Once the recursion is understood, the Excel setup is mechanical: anchor the multiplier cell, seed the first EMA, then drag a single formula down. The rest of this guide walks through the column layout, the formulas, common pitfalls, and the role of the Exponent Calculator for spot-checking decay weights when the period changes.
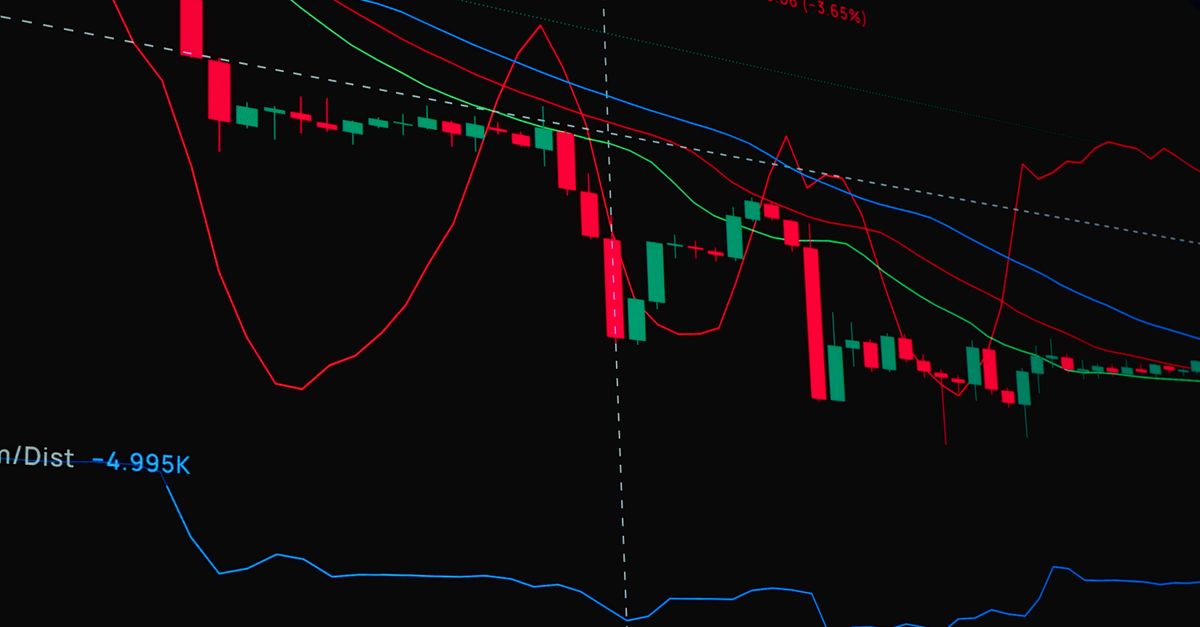
How the EMA Formula Uses Exponents
The exponentially weighted moving average is recursive: each new EMA value blends today's price with the previous EMA, scaled by a multiplier k. The standard form is:
EMA_today = (Close_today − EMA_yesterday) × k + EMA_yesterday
The multiplier k, sometimes called the smoothing factor or weighting coefficient, is calculated as k = 2 ÷ (N + 1), with N being the lookback period. The "exponential" in the name comes from how each historical weight decays geometrically. Today's price carries weight k, yesterday's carries weight k(1 − k), the day before carries k(1 − k)², and so on. The exponent grows by one with each step back in time, which is exactly what an exponent calculator produces: a base raised to a power.
In practice, Excel handles this recursion automatically once the formula is laid out correctly, but the underlying decay weights, the multiplier for a custom N, and the contribution of an older observation still need to be checked occasionally. The Exponent Calculator returns base^exponent as you type, so (1 − k)^t becomes a single lookup instead of a manual multiplication chain. It handles decimals and reciprocal steps cleanly, which is exactly what EMA decay factor verification needs.
The EMA Components in One Place
| Component | Formula | What it does |
|---|---|---|
| EMA value | (Close − EMA_prev) × k + EMA_prev | Blends today's close with yesterday's EMA using the multiplier |
| Multiplier k | 2 ÷ (N + 1) | Smoothing factor for period N (also called α or smoothing constant) |
| Seed EMA | First close, or SMA of first N closes | Starting value before the recursion can begin |
| Weight at lag t | k × (1 − k)^t | How much weight an observation t periods ago still contributes |
| Wilder's variant | 1 ÷ N | Alternative multiplier used in RSI, ATR, and other Welles Wilder indicators |
The two right-hand columns are fixed relationships — the kind of thing to write once and reuse. The actual numbers depend on the chosen period and the prices in the data; get them from the Excel formulas in the next section or from the Exponent Calculator for spot checks.
How to Calculate EMA in Excel
- Lay out the closing prices. Put a header such as "Date" in A1 and "Close" in B1, with daily closes in B2 downward. If the data has more than one symbol, repeat the column block for each symbol rather than mixing them.
- Pick a period and store the multiplier. Type the period (for example 10) in a fixed cell like D1. In D2, enter =2/($D$1+1). The dollar signs lock the reference so the formula does not shift when copied down.
- Seed the first EMA value. In C2, type the seed — either the first close (=B2) for simplicity, or the simple moving average of the first N closes for a cleaner start. Label the header in C1 as "EMA".
- Write the recursive EMA formula. In C3, enter =(B3-C2)*$D$2+C2. Read this as "today's close minus yesterday's EMA, scaled by the multiplier, plus yesterday's EMA". Excel evaluates it row by row, so each C cell depends only on the row above.
- Copy the formula down. Select C3 and drag the fill handle down to the last row of data. Excel recomputes the EMA recursively for every subsequent day.
- Format and chart. Apply a number format such as two decimal places, then plot the Close and EMA series on a line chart to visualize the smoothing effect against the raw price.
If a single-column layout is preferred, use =B2 as the seed in C2 and start the recursion from row 3 with the formula above. The structure stays identical whether the sheet has 50 rows or 50,000 — Excel only needs the multiplier anchored and the recursion defined once.
Verifying the Decay Weights with the Exponent Calculator
The EMA multiplier k is small (about 0.18 for a 10-period EMA), but the decay still matters. An observation from 20 days ago influences today's EMA through the factor (1 − k)^20. To see what that factor actually is for any period, plug 1 − k as the base and the lag as the exponent into the Exponent Calculator. It shows the expansion for small whole-number exponents and handles decimals and reciprocals cleanly, so older observations can be verified as either meaningfully contributing or essentially negligible depending on the chosen period.
For example, with a 10-period EMA (k ≈ 0.1818), the decay factor for an observation 20 days back is (1 − 0.1818)^20 = 0.8182^20. That single lookup answers the question "how much weight does day T-20 still carry?" without multiplying 0.8182 by itself 20 times by hand. The same approach works for any custom period: compute k, then raise (1 − k) to whatever lag matters. For another application of the same exponent tool on the growth side of the same idea, the guide to calculating exponential growth walks through percentage growth using the same calculations in reverse.
Choosing a Smoothing Period
The period N drives the trade-off between responsiveness and smoothness. Short periods (5 to 10) hug recent prices tightly and react within a few bars, which makes them popular for short-term trading signals. Longer periods (20 to 50) smooth out noise at the cost of lagging behind real turning points, and very long periods like 100 or 200 are used as slow trend references.
| Period range | Multiplier formula | Typical use |
|---|---|---|
| 5–10 | 2 ÷ (N + 1) | Short-term entries and exits; reacts within a few bars |
| 20–30 | 2 ÷ (N + 1) | Medium-term trend, common swing-trading default |
| 50–200 | 2 ÷ (N + 1) | Long-term trend filters and macro references |
| Wilder style (N) | 1 ÷ N | RSI, ATR, and other Welles Wilder indicators |
Pick one based on the question being asked, not on what looks popular elsewhere. Forcing a 10-period EMA onto a weekly chart produces a noisier result than a 20-period EMA would, and the relationship is purely arithmetic: as N grows, the multiplier k shrinks, and EMA reacts more slowly. The exact multiplier comes from the formula above; if the question is how much weight a specific historical bar still carries, raise (1 − k) to the lag using the Exponent Calculator.
Pitfalls in Excel EMA Calculations
Three mistakes account for most broken EMA sheets:
- Unanchored multiplier. If the multiplier is typed as a literal number rather than as =2/($D$1+1), changing the period later will not update the EMA column. Always reference a single cell so the entire column reacts to a single edit.
- Bad seed value. Seeding with 0 or with a non-matching date can drag the EMA visibly away from price for the first N periods. Use the first close for short sheets or the first N-close SMA for longer ones, and document the choice so it is reproducible.
- Stale lookup references. If the EMA value is pulled with VLOOKUP, INDEX/MATCH, or XLOOKUP from a date that has no row in the EMA column, the formula returns a stale or missing value. Use structured table references or whole-column ranges so the lookup always finds the row it expects.
Finally, remember that the multiplier is a fraction, not a percentage. If 18.18 is typed instead of 0.1818, the EMA will explode within a handful of periods because each day's contribution will be larger than the previous EMA, and the (Close − EMA_prev) term keeps amplifying on every subsequent row. The chart will shoot off the screen, and the underlying numbers will be unrecoverable without rebuilding the column.
Related reading: How to Calculate Logarithm in Excel (LN, LOG, LOG10).