Body fat percentage loss is the relative drop in your body-fat percentage from a starting point to a later point, calculated as (initial BF% − current BF%) ÷ initial BF% × 100. Two people can weigh exactly the same and still differ in body-fat percentage by more than ten points, which is why the bathroom scale never tells the full story of a fat-loss plan. To compute the loss, you need two body-fat readings taken under comparable conditions and a simple division. The quickest way to get those readings is a tape-measure Body Fat Calculator, which estimates your current body-fat percentage from height, neck, and waist (plus hip for women) in centimetres using the U.S. Navy circumference method. That estimate updates instantly as you type, so you can take the first measurement today, log the number, and come back weeks later to take a second measurement and watch the trend play out. Everything is computed locally in your browser, so nothing you type is uploaded or stored.
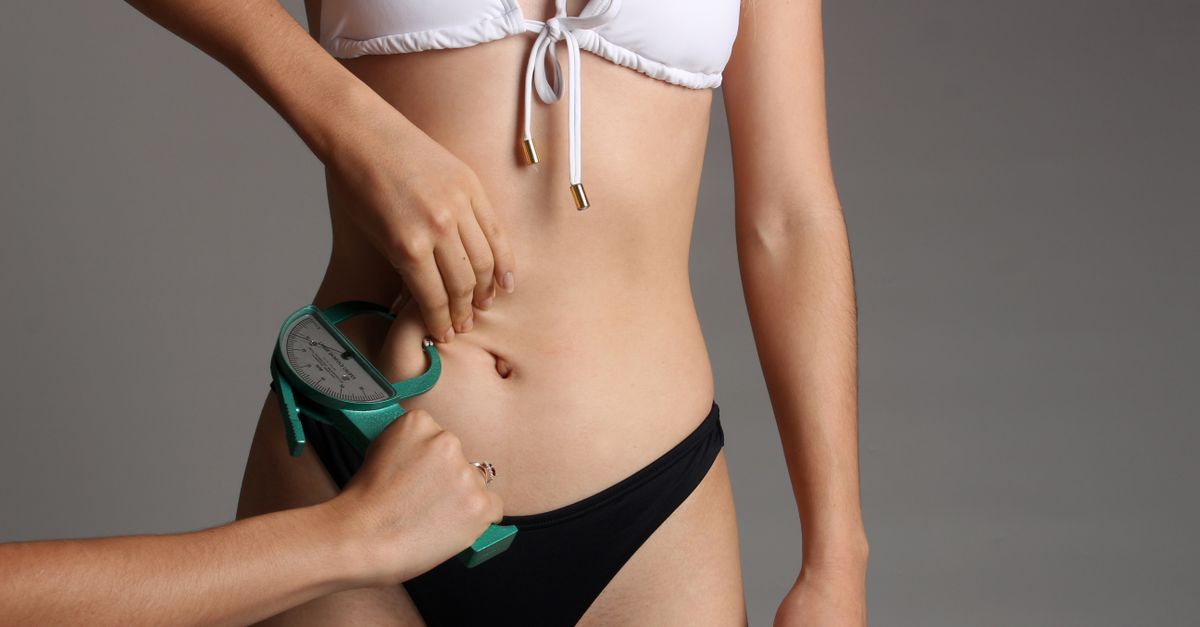
What the Loss Number Really Means
Body fat percentage loss is a ratio, not a weight. The formula above tells you what fraction of your original body fat you have shed, which is more comparable across people of different starting weights than the raw number of pounds or kilograms lost. A 200-pound person who drops from 30% to 22% body fat has lost the same relative body fat as a 150-pound person who drops from 30% to 22% body fat, even though the absolute fat mass lost in kilograms is very different.
This metric is also more informative than the bathroom scale because two people of identical weight can carry very different amounts of fat and lean tissue. A rising body-fat estimate alongside steady weight often flags muscle loss, while a falling estimate during resistance training is the classic signature of recomposition, where fat is being lost and muscle gained at the same time. That is why the same weekly weigh-in can tell two opposite stories and why body-fat percentage is the variable worth tracking when the goal is recomposition rather than pure weight loss.
The Body Fat Loss Percentage Formula
Once you have two body-fat readings, the loss calculation is short enough to do on the back of a napkin:
Body fat loss % = (initial BF% − current BF%) ÷ initial BF% × 100
For example, suppose your first reading from the calculator is 20.2% body fat, and eight weeks later a second reading under the same conditions comes back at 14.0%. The change in percentage points is 20.2 − 14.0 = 6.2 points, but the relative body-fat loss is:
(20.2 − 14.0) ÷ 20.2 × 100 = 6.2 ÷ 20.2 × 100 ≈ 30.7% body fat lost
Notice that 30.7% describes the reduction in your fat, not your final body-fat percentage. You have shed roughly thirty per cent of the fat you started with, not thirty per cent of your body weight. This is the number that lets you compare progress against published fat-loss studies, photos, or trainer benchmarks, because everyone starts from their own baseline. A 10% body-fat loss is a meaningful achievement regardless of whether you began at 30% or 18%.
Get Your Two Readings With the Body Fat Calculator
The U.S. Navy circumference method turns a few tape-measure numbers into a body-fat estimate without calipers, scales, or hydrostatic weighing. The full procedure is small enough to do in a quiet corner of your home, and the same routine should be used for both the starting and the follow-up reading so the two numbers are comparable.
- Pick your sex in the calculator, then grab a flexible vinyl tape and a mirror or a helper. Have the tape, the calculator, and a notebook or note-taking app ready so you can log each number immediately.
- Take the measurements on bare skin, standing relaxed. Measure the neck just below the larynx with the tape sloping slightly downward at the front. Measure the waist at the navel for men, at the narrowest point for women. Women also measure the hips at the widest point around the buttocks. Measure your height in centimetres, in bare feet against a door frame.
- Keep the tape level, parallel to the floor, snug but not compressing, and read it after a normal exhale. Take each measurement two or three times and average the readings, because a single centimetre off can shift the final body-fat percentage by roughly one point.
- Type each measurement into its field in the Body Fat Calculator in centimetres. The estimate updates instantly as you type, so you can sanity-check that a small tape change produces a sensible change in the result. Record the displayed percentage to one decimal place in your log.
- Repeat the same routine, in the same conditions (ideally morning, before eating), four to twelve weeks later. Type the new measurements into the same calculator and record the new percentage. Now you have two comparable readings to feed into the loss formula.
Where the two measurements differ by sex
The Navy equations use different inputs for men and women, which is why the calculator adds a hip field when you select female. The men's formula uses waist minus neck, capturing abdominal fat. The women's formula uses waist plus hip minus neck, reflecting how female body-fat distribution includes substantial lower-body fat. The table below summarises the exact tape positions for each sex so the two readings are taken at identical anatomical landmarks.
| Measurement | Men | Women |
|---|---|---|
| Neck | Just below the larynx, tape sloping slightly down at front | Just below the larynx, tape sloping slightly down at front |
| Waist | At the navel | At the narrowest point |
| Hips | Not used in the formula | At the widest point around the buttocks |
| Height | Required, in centimetres | Required, in centimetres |
Measure the Same Way Every Time
Consistency is what turns two separate readings into a trend line. The two largest sources of error in this kind of self-tracking are body position on the tape and the time of day, so lock both down before you take either reading. Morning measurements before eating, on bare skin, standing relaxed rather than flexed or sucked in, with the tape snug but not compressing, give the most repeatable numbers. The same helper or mirror should be used if possible, because self-measuring the neck or hips from an awkward angle can quietly shift a centimetre or more.
Logging the raw measurements, not just the percentage, gives you something to recompute if you ever want to check the work or compare against a different method. A simple paper table with columns for date, weight, neck, waist, hip, height, and the calculator's output is usually enough. If your height has not changed between readings, you can even skip re-measuring it and reuse the original centimetre value, which removes one variable from the comparison.
Reading the Trend Over Weeks and Months
Once you have three or more body-fat readings spaced a few weeks apart, plot them on a simple line chart and look at the slope rather than any single point. The U.S. Navy method typically lands within about three to four percentage points of gold-standard techniques like DEXA or hydrostatic weighing for average adults, so a single reading bouncing up or down by a point or two is more likely tape noise than real change. A consistent drift downward across multiple readings, taken with the same protocol, is the signal worth acting on.
For a rough frame of reference, the categories below are the bands most often cited by exercise-science bodies such as the American Council on Exercise. They are population averages, not pass-or-fail thresholds, and the calculator's own fitness-band label uses a simpler version of the same idea.
| Category | Men | Women |
|---|---|---|
| Essential fat | 2–5% | 10–13% |
| Athletes | 6–13% | 14–20% |
| Fitness | 14–17% | 21–24% |
| Average | 18–24% | 25–31% |
| High | 25% and above | 32% and above |
Whether you are reading a single percentage or a trend, the takeaway is the same: the number is most useful as a way to compare yourself to an earlier version of yourself under the same conditions, not as a daily judgement. If you want a deeper walk-through of the tape technique before you start logging, the step-by-step guide on measuring body fat at home without scales or calipers pairs naturally with this calculator.
Where the Tape-Measure Estimate Falls Short
Because the U.S. Navy method is calibrated on large population averages, it is best treated as a screening estimate rather than a clinical body-composition measurement. It can be less accurate for very lean, very muscular, or older individuals, because the underlying statistical model does not match their body proportions as well. The method also assumes that waist and hip circumferences correlate with the ratio of fat to lean mass, which is true on average but says nothing about exactly where the fat sits on any specific person.
For that reason, the calculator's output is paired with a simple fitness-band label, and the underlying assumption is that a clinical body-composition assessment, cardiovascular-risk evaluation, or any health decision belongs to a qualified healthcare professional using validated equipment. Use the percentage loss to track your training and nutrition trends over weeks and months, and bring the log with you to that conversation if a number feels worth discussing in clinical terms.