Average deviation measures how far each value in a dataset strays from the mean, then averages those distances — for a list of numbers x₁ through xₙ, the mean absolute deviation is MAD = (1/n) · Σ |xᵢ − mean|. To compute it, you first find the mean of the data, then the absolute distance of every point from that mean, and finally the average of those distances. The mean itself is the arithmetic center of any list and serves as the baseline that every deviation is measured against. Working out the mean by hand is straightforward — add every number and divide by how many there are — but it quickly becomes slow and error-prone once the list grows past a handful of values or contains negatives, decimals, and scientific notation. The Average Calculator handles the mean, median, mode, sum, count, min, max, and range in a single pass, and it does the work entirely in your browser, so the numbers never leave your device. Treat the mean it returns as the reference point for any deviation formula you run next, whether that is mean absolute deviation or standard deviation.
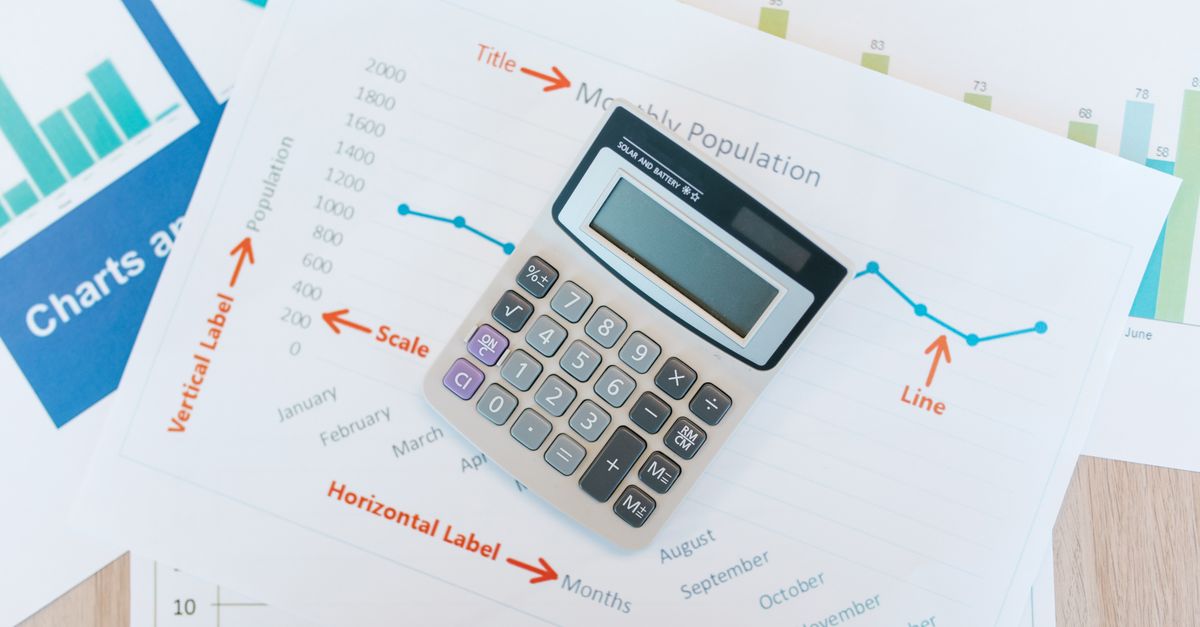
What Average Deviation Means in Statistics
In statistics, the word "average" almost always refers to the arithmetic mean, and "deviation" refers to the distance of any single value from that mean. Average deviation, more formally known as mean absolute deviation (MAD), summarizes how spread out the data is by averaging the size of those distances while ignoring whether each one sits above or below the mean. It is one of several ways to describe variability, sitting alongside the variance, the standard deviation, and the simple range.
MAD is calculated in three stages: find the mean, measure the absolute distance of every value from it, and divide the total by the count. Because deviations are taken in absolute value, MAD is always positive or zero, and it keeps the same units as the original data, which makes the result easy to interpret. A small MAD means the values cluster tightly around the mean; a large MAD means the dataset is more scattered. Average deviation is not the same thing as average on its own — the average is the center, the deviation is how far the points stray from that center. Reports sometimes use the words loosely, which is why a calculator that returns both the mean and the spread side by side is the cleanest way to keep these ideas straight.
Find the Average and Spread in Three Steps
The fastest path to the mean — and the spread information that pairs with average deviation — is to run your numbers through the Average Calculator. It updates every value live as you type, so you can edit the list freely and watch the results adjust without reloading the page or hitting a submit button.
- Open the Average Calculator and locate the input box near the top of the page.
- Type or paste your numbers, separating them with commas, spaces, or new lines — any combination works, and negatives, decimals, and scientific notation such as 1.2e3 are accepted.
- Read the mean, median, mode, sum, count, min, max, and range as they appear below the box, then click Copy if you need the full summary for a report, email, or spreadsheet.
Everything is calculated client-side, so large lists run instantly and your data stays private. If a stray word slips into the box, the calculator ignores it and notes how many entries were skipped, so an accidental label never breaks the result.
How Mean, Median, and Mode Tell Different Stories
Three different "averages" can sit at the center of the same dataset, and each one answers a slightly different question. Picking the right one matters when you then compute average deviation, because the deviation always rides on top of whichever center you chose. The table below summarizes the formulas and the situations where each measure shines.
| Measure | How it is found | Best for |
|---|---|---|
| Mean | Sum of values ÷ count | Symmetric data with no extreme values |
| Median | Middle value, or average of the two middle values for an even count | Skewed data, incomes, response times |
| Mode | Most frequent value | Most common result, categories, ratings |
| Range | Maximum − minimum | A quick look at total spread |
The mean uses every value, which makes it precise but also sensitive to outliers — one unusually large or small value pulls it noticeably. The median only cares about position, so it barely moves when an outlier appears; it is the better summary for skewed data such as incomes or house prices. The mode is the only average that also works for categories, and it highlights the most frequent outcome rather than a typical amount. A dataset can have one mode, several modes (multimodal), or no mode at all when every value is unique.
Computing all three at once is often the most revealing move. When the mean and median are close, the data is fairly balanced; when the mean sits well above the median, a few large values are stretching it upward, and average deviation from the median is usually smaller than average deviation from the mean.
Reading the Range and Spotting Spread
The Average Calculator reports the minimum, maximum, and range alongside the center measures. Range is simply maximum minus minimum, so it is a one-glance summary of how far apart the smallest and largest values are. It is a cruder measure of spread than average deviation because it ignores everything in between, but it points to outliers quickly: a dataset whose range is many times its mean usually contains an extreme value worth investigating.
Consider the worked example of 2, 4, 4, 9. The sum is 19 across 4 values, so the mean is 4.75. Sorted, the values are 2, 4, 4, 9 — the two middle values are both 4, so the median is 4 and the mode is also 4. The minimum is 2, the maximum is 9, and the range is 7. Plugging the mean into the MAD formula: |2 − 4.75| + |4 − 4.75| + |4 − 4.75| + |9 − 4.75| = 2.75 + 0.75 + 0.75 + 4.25 = 8.5, and 8.5 ÷ 4 = 2.125, so the average absolute deviation for this dataset is 2.125.
That single chain shows the role of each piece: the mean is the baseline, the absolute distances are the deviations, and dividing by n turns them into an average. For larger datasets, paste the full list into the tool to skip the by-hand steps and reserve the formula for the interpretation.
When Deviation Calls for the Median, Not the Mean
If the dataset looks skewed — a long tail on either side, or a few extreme values that dwarf the rest — the median is the more honest center, and computing deviations around it gives a more representative spread. Incomes and house prices are the textbook example: one billionaire can pull the mean far above what most people earn, while the median stays grounded in the middle of the data. Deviations from that median describe how most of the data is scattered without being distorted by the extremes.
For roughly symmetric data — test scores, evenly spaced measurements, balanced samples — the mean is the right center and the natural baseline for average deviation. When in doubt, compute both, glance at the gap between mean and median, and pick the center that better represents a typical value. The Average Calculator shows all three averages side by side, which makes this comparison a single step rather than a separate calculation.
Putting the Calculator to Work on Real Lists
Once the mean and range are in hand, average deviation is a short formula away, and it is rarely the only number a report needs. The same mean feeds grade curves, survey summaries, performance reviews, equipment response times, and budget averages. Pasted into the Average Calculator, a column of test scores returns a mean that doubles as a class average, a median that reveals whether a tough exam dragged the average down, and a range that shows the spread between top and bottom students.
The tool accepts negatives, decimals, and scientific notation such as 1.2e3, so a list mixing ordinary grades with adjusted scores or weighted values handles cleanly in one box. Because the calculation runs entirely client-side, your data is not uploaded, which makes the tool equally useful for private figures (personal finances, medical readings) and shared ones (team metrics, public statistics). For each use case, treat the mean as your baseline and the range or computed MAD as your spread indicator, then pair them in any report that needs both a center and a sense of how scattered the data is around it.
If you're weighing options, How to Calculate Average in Excel: AVERAGE & More covers this in detail.
If you're weighing options, How to Calculate Average Inventory Step by Step covers this in detail.