Generate an audio waveform when you need a static visual overview of amplitude over time, especially when the result must be an editable SVG with fixed dimensions and colors. This is a presentation and inspection task: time moves from left to right, and each vertical mark shows the minimum and maximum sample range found in a section of the audio. It is not a complete analysis of what the recording contains or how loud it will sound.
For that specific need, the Audio Waveform Generator decodes one selected file in the current browser tab, calculates a bounded peak envelope, previews it, and exports the inspected SVG. Audio decoding, peak extraction, SVG generation, preview, and download all happen locally; neither the audio file nor the generated graphic is uploaded to Lizely. The result is text-based SVG rather than PNG, JPEG, video, or audio.
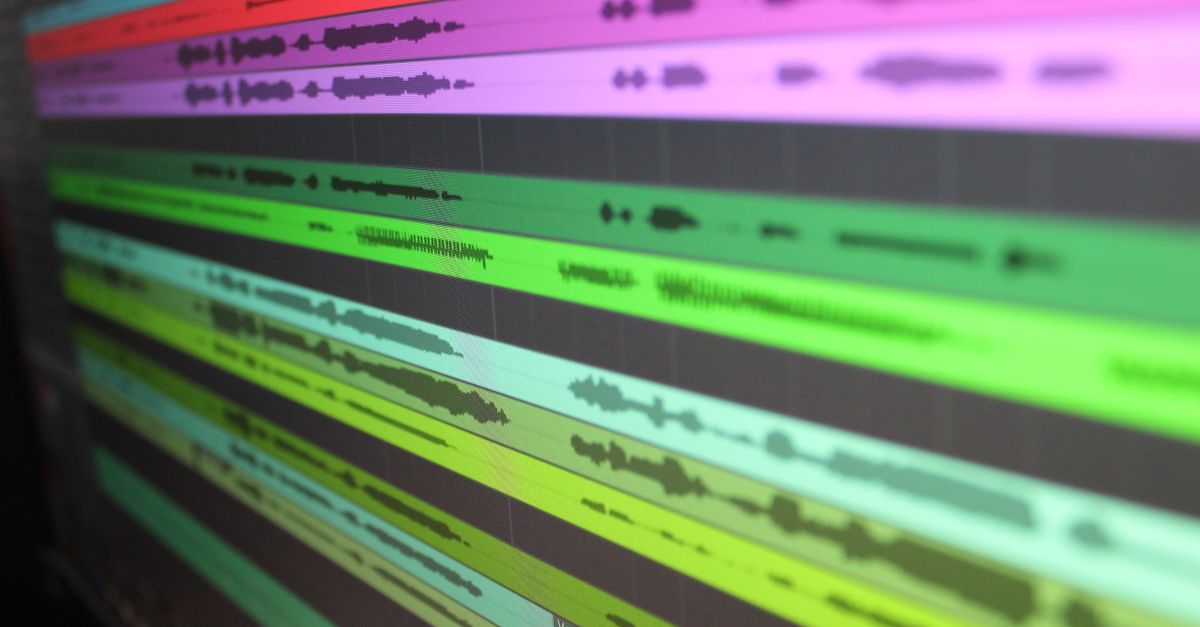
When an Audio Waveform Adds Value
The right trigger is a communication need: show the broad shape of a recording in a place where viewers cannot play it or need a quick visual summary. A waveform is especially useful when an editor, designer, or developer needs a repeatable vector asset rather than a temporary player display.
- Web or document illustration: Add audio context beside a tutorial, case study, chapter marker, or article without requiring an interactive player.
- Editorial or design review: Review the broad amplitude envelope across the recording.
- Layout planning: Reserve a predictable area for an audio visual and establish a consistent appearance for a clip or collection.
- SVG handoff: Supply exact dimensions, background and waveform colors, and editable vector markup to an SVG-aware editor.
- Local processing: Create the overview in the current browser tab without sending the source audio to a server.
Do not generate a waveform merely because an audio file exists. The visual can show where activity is concentrated over time, but it cannot explain why that activity is present or reveal musical structure by itself.
Match the Question to the Right Visualization
Start with the question the visual must answer. Different outputs solve different problems, and choosing the wrong one can make a simple illustration look like analytical evidence.
| Question | Best-fit output | Why |
|---|---|---|
| How does sample amplitude change over time? | Time-domain waveform | A peak envelope is designed to show this pattern. |
| Which frequencies are present? | Spectrogram or frequency analyzer | The SVG's vertical axis represents amplitude, not frequency. |
| How loud does the recording sound? | Calibrated loudness measurement | Peaks alone do not account for duration, frequency balance, dynamics, or playback conditions. |
| Where are the beats, notes, transients, or musical structure? | Specialized audio analysis | The generator does not calculate these features. |
| Do the left and right channels differ? | Audio editor with separate channel tracks | The generator combines all channels into one overview. |
| Is the audio clipped, phase-impaired, or noncompliant? | Measurement tools and qualified review | A static picture cannot diagnose those conditions. |
| Do I need PNG, video, or an audio file? | Format-specific editor or exporter | The generator downloads SVG only. |
The Audio Waveform Generator is appropriate for the first row: a static visual overview with controlled geometry and colors. Treat it as an illustration or reference asset, not as proof of a recording's perceived loudness, frequency content, channel balance, or technical compliance.
What the SVG Actually Measures
The output is a time-domain peak envelope. Decoded frame indices are divided into equal, contiguous ranges. For every range, the tool finds the minimum and maximum finite sample across all decoded channels, clamps defensive out-of-range values to -1 through 1, and draws one vertical line from the bucket maximum to its minimum. The number of columns is the smaller of the requested image width, 1,000, and the decoded frame count. A short clip therefore does not invent independent measurements, while a long clip remains within a bounded SVG and processing budget.
For stereo and multichannel audio, the result is one combined peak overview. A bucket can take its minimum from one channel and its maximum from another. The image does not display separate channel lanes, preserve channel identity visually, or average the channels into a new audio signal. The original audio is never rewritten. If separate left and right waveforms are required, use an audio editor that exposes each channel as its own track.
The coordinates follow fixed rules. The vertical center is half the requested height, while full-scale positive or negative samples extend to 45 percent of the height above or below that center. This leaves a five-percent margin at the top and bottom, and columns are evenly centered across the selected width.
Generate a Compliant Waveform Locally
Use this workflow when the file, settings, and intended output meet the generator's boundaries.
- Select one browser-decodable audio file. MP3, WAV, M4A, AAC, Ogg, WebM, and FLAC are read through Web Audio only when the current browser and operating system support the real codec; an extension or MIME label cannot guarantee decoding. The compressed file must be at most 50 MiB. Decoded audio must last no more than five minutes, contain one through eight channels, use a sample rate from 8,000 through 192,000 Hz, and remain within 30 million channel samples. Over-limit audio is rejected as a whole rather than silently reduced to its beginning. This browser-side stage uses the Web Audio API's AudioBuffer model.
- Set the SVG dimensions and colors. Choose a width from 320 through 1,600 pixels and a height from 120 through 600 pixels. Select the background and waveform colors with six-digit hexadecimal controls. These settings determine the final fixed-pixel SVG rather than changing the source audio.
- Generate the local peak envelope. The tool divides the decoded frame indices into contiguous buckets, calculates the minimum and maximum across every channel in each bucket, and creates the corresponding vertical peak lines. The generation and SVG construction remain in the current tab.
- Check the counts and inspect the result. Review the reported decoded frame count and peak-column count. Open the preview or expandable SVG inspector and confirm that the dimensions, viewBox, background, waveform color, and line set match your intended asset.
- Download the exact SVG. The download uses the identical string shown in the inspector. It is editable text-based SVG that can be opened in an SVG-aware editor and remains sharp when placed at another display size. If you replace the file, change an option, generate again, or leave the page, the obsolete object URL is revoked so an older image cannot appear to represent the new inputs.
Review the Asset Before Publishing
Treat the preview as a final design asset rather than a temporary thumbnail.
- Counts: The expected column count is the smaller of the requested width, 1,000, and the decoded frame count. A brief recording may contain fewer columns, while a long recording remains capped.
- Dimensions: Confirm that the requested width and height match the SVG's fixed pixel dimensions and matching viewBox.
- Appearance: Check the background and waveform colors, the density of the lines, and the five-percent top and bottom margins.
- Output identity: Inspect the SVG text, which contains a background rectangle and a group of peak lines, and confirm that the downloaded file is the same string shown in the preview.
Keep the interpretation limits in view as well. A peak waveform is not a calibrated loudness meter, and two recordings with similar peaks can sound very different. It is also not a spectrogram: time runs left to right, but the vertical line represents sample amplitude range rather than frequency. Do not use the picture to diagnose hearing, equipment, clipping history, phase, or mastering compliance. Extremely large print or editing workflows may also require different stroke widths or more detailed source data.
Place the Result in Your Project
Use the SVG in a web page, slide deck, document, editorial layout, design mockup, or SVG-aware editor. It works best where one still image communicates a broad amplitude pattern and where vector scaling, precise colors, and inspectable markup are priorities. Because the file contains fixed pixel dimensions and a matching viewBox, it stays sharp when displayed at another size.
For an After Effects project, follow the steps for how to pull a custom audio waveform SVG into After Effects. If a destination requires PNG, JPEG, video, or an audio file, export or convert the asset separately in suitable software. Do not use this static SVG for sample-accurate editing, separate-channel display, playback, or analytical conclusions.